اختبار اختيار من متعدد تفاعلي: مراجعة نهائية وفق الهيكل
Al Salamat School Final Revision for Grade 8 Science. This test covers Module 1: Introduction to Waves for the third trimester of the 2025-2026 academic year. Created by Mr. Issa Waswas.
🏆 انضم إلى التحدي واحصل على ترتيبك
اختبار شهادة تدريبي مؤقت للصف والمادة والفصل نفسه.
اختر إجابة واحدة لكل سؤال. عند الاختيار ستظهر النتيجة فورًا: الأخضر صحيح، والأحمر خطأ، وسيظهر تفسير الإجابة مباشرة إن كان متوفرًا. وبعد آخر سؤال ستظهر الدرجة النهائية تلقائيًا.
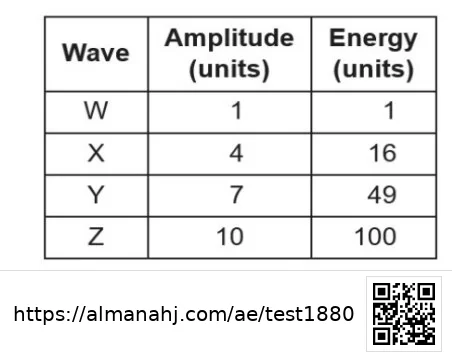
Which equation best represents the relationship between the amplitude (A) of an ocean wave and its energy (E), shown in the table below?
Explanation
The table shows that for every wave, the energy is the square of the amplitude (12=1, 42=16, 72=49, 102=100). Therefore, the equation is E = A2.
Question 2
Points: 1
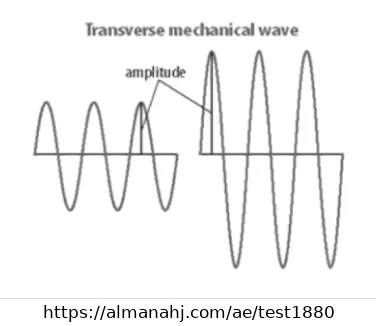
What change could explain the difference between the waves shown in the diagram?
Explanation
The diagram shows an increase in the amplitude of the waves. Since amplitude is directly related to the energy of a wave, an increase in amplitude indicates that more energy was provided by the source.
Question 3
Points: 1
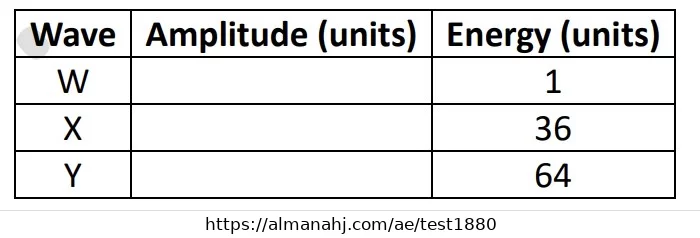
Which row correctly shows the amplitude of all three waves based on the relationship between amplitude and energy shown in the table?
Explanation
Using the relationship E = A2, the amplitude (A) is the square root of the energy (E). For W, $\sqrt{1} = 1$. For X, $\sqrt{36} = 6$. For Y, $\sqrt{64} = 8$.
Question 4
Points: 1
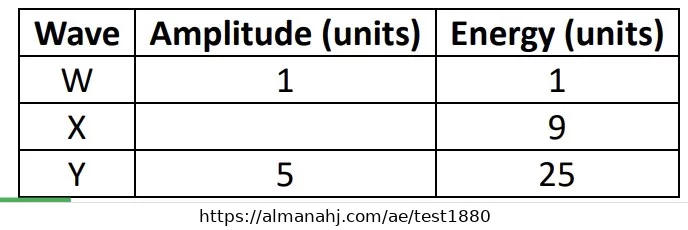
Which correctly shows the amplitude of wave X in the table below?
Explanation
Energy is proportional to the square of the amplitude (E = A2). Since wave X has an energy of 9 units, its amplitude is $\sqrt{9} = 3$ units.
Question 5
Points: 1
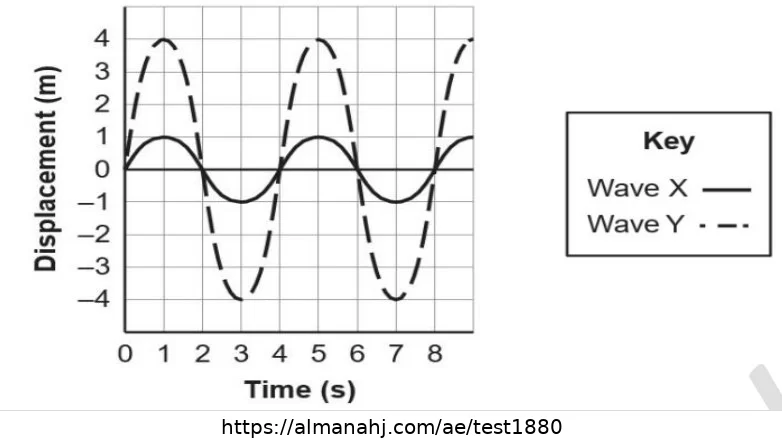
This graph represents sound waves generated by a vibrating string at two energy levels. Which statement best describes the difference in energy between Wave X and Wave Y?
Explanation
Wave X has an amplitude of 1 unit, and Wave Y has an amplitude of 4 units. Because energy is proportional to the square of the amplitude ($E \propto A^2$), the ratio of their energies is 42 / 12 = 16.
Question 6
Points: 1
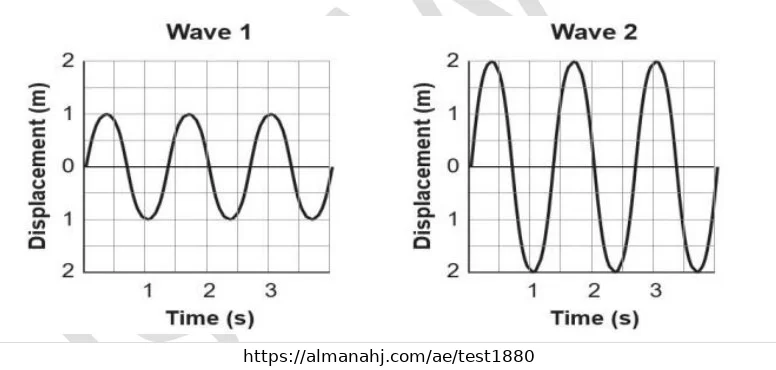
The graphs show two waves with the same frequency. By what factor did the energy change from Wave 1 to Wave 2?
Explanation
Wave 1 has an amplitude of 1, and Wave 2 has an amplitude of 2. Since energy is proportional to the square of the amplitude, doubling the amplitude (22) results in a 4-fold increase in energy.
Question 7
Points: 1
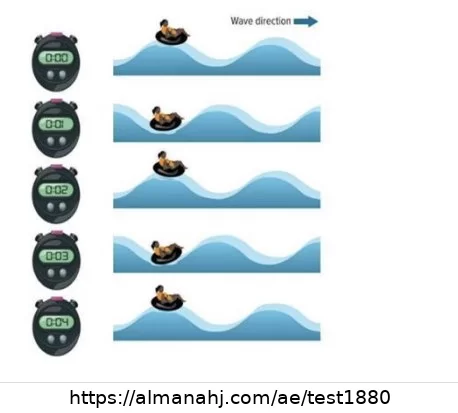
What is the frequency of the wave shown in the image below?
Explanation
Looking at the images, the wave starts at a crest at t=0 and reaches the next crest at t=2 seconds. Therefore, the period (T) is 2 seconds. Frequency (f) is 1/T, so 1/2 = 0.50 Hz.
Question 8
Points: 1
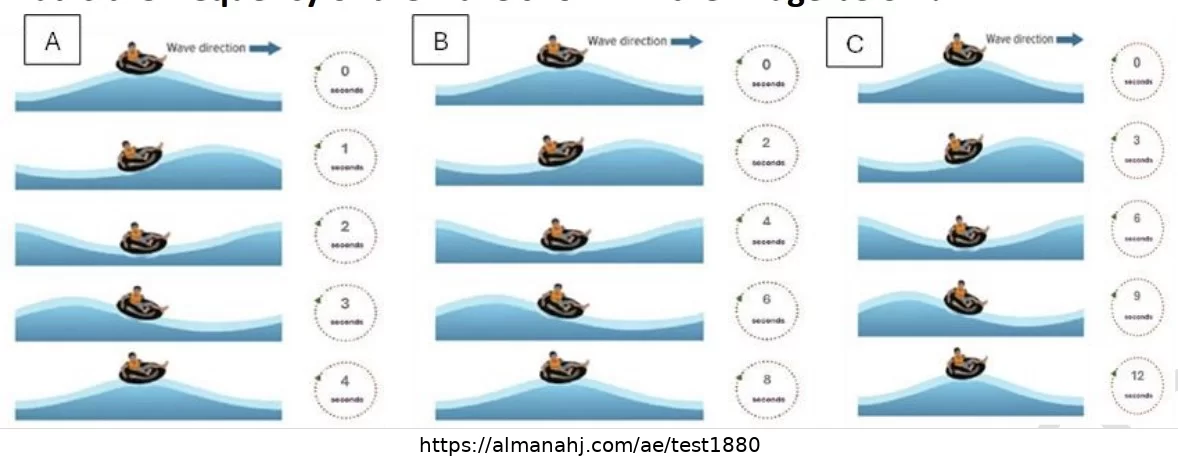
Use the image to answer: What is the frequency of the wave shown in Image A?
Explanation
Frequency is the number of waves per second. Image A shows one wave cycle every 4 seconds, so f = 1 / 4 = 0.25 Hz.
Question 9
Points: 1
Use the image to answer: What is the frequency of the wave shown in Image B?
Explanation
Image B shows one wave cycle every 8 seconds, so the frequency is f = 1 / 8 = 0.125 Hz.
Question 10
Points: 1
Use the image to answer: What is the frequency of the wave shown in Image C?
Explanation
Image C shows one wave cycle every 12 seconds, so the frequency is $f = 1 / 12 ≈ 0.083$ Hz.
Question 11
Points: 1
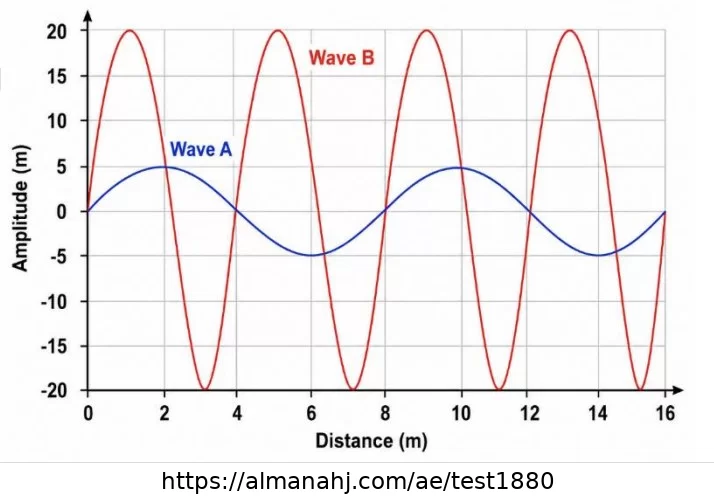
Use the graph to answer: What is the amplitude of Wave A?
Explanation
Amplitude is the maximum displacement from the equilibrium line. Wave A reaches about 5 m from the center line.
Question 12
Points: 1
Use the graph to answer: What is the amplitude of Wave B?
Explanation
Amplitude is measured from the midline to the crest. Wave B reaches about 20 m from the center line.
Question 13
Points: 1
Assuming both waves travel at the same speed, which wave has the greater frequency?
Explanation
For waves moving at the same speed, shorter wavelength means higher frequency. Wave B has more cycles in the same distance, so it has the greater frequency.
Question 14
Points: 1
Use the graph to answer: Which statement best compares Wave A and Wave B?
Explanation
Wave B has a larger amplitude than Wave A, and it completes more waves over the same distance, which means it has a shorter wavelength.
Question 15
Points: 1
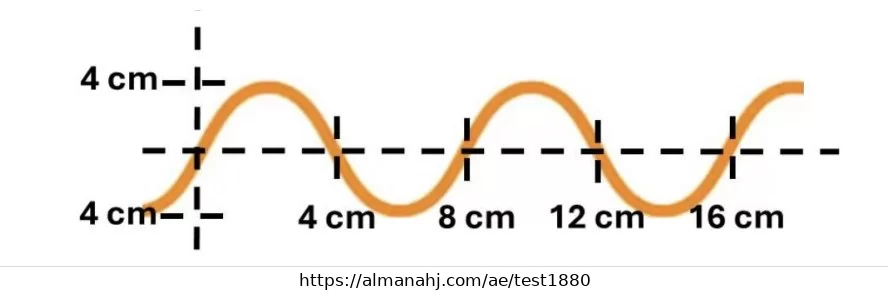
Determine the amplitude of the wave shown in the image below.
Explanation
Amplitude is the distance from the equilibrium line to a crest or trough. The image shows this distance as 4 cm.
Question 16
Points: 1
Joni plays a scale on her clarinet. As she plays from low notes to high notes, what happens to the sound waves that the clarinet creates?
Explanation
Higher notes have higher pitch, and pitch increases when the frequency of the sound wave increases.
Question 17
Points: 1
How is frequency related to pitch?
Explanation
Pitch depends on frequency. Higher frequency means higher pitch, while lower frequency means lower pitch.
Question 18
Points: 1
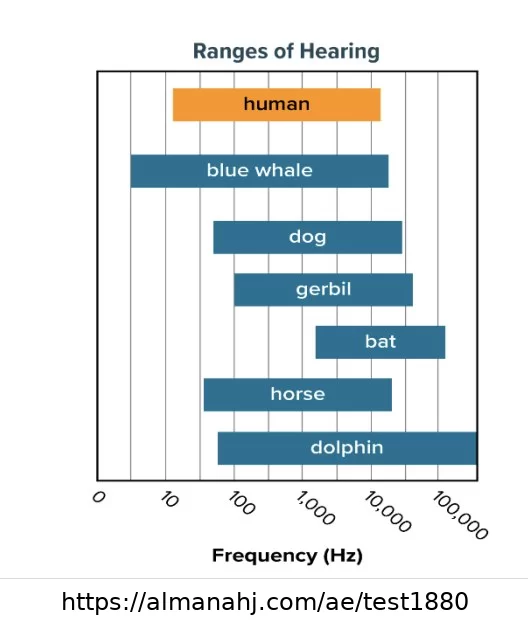
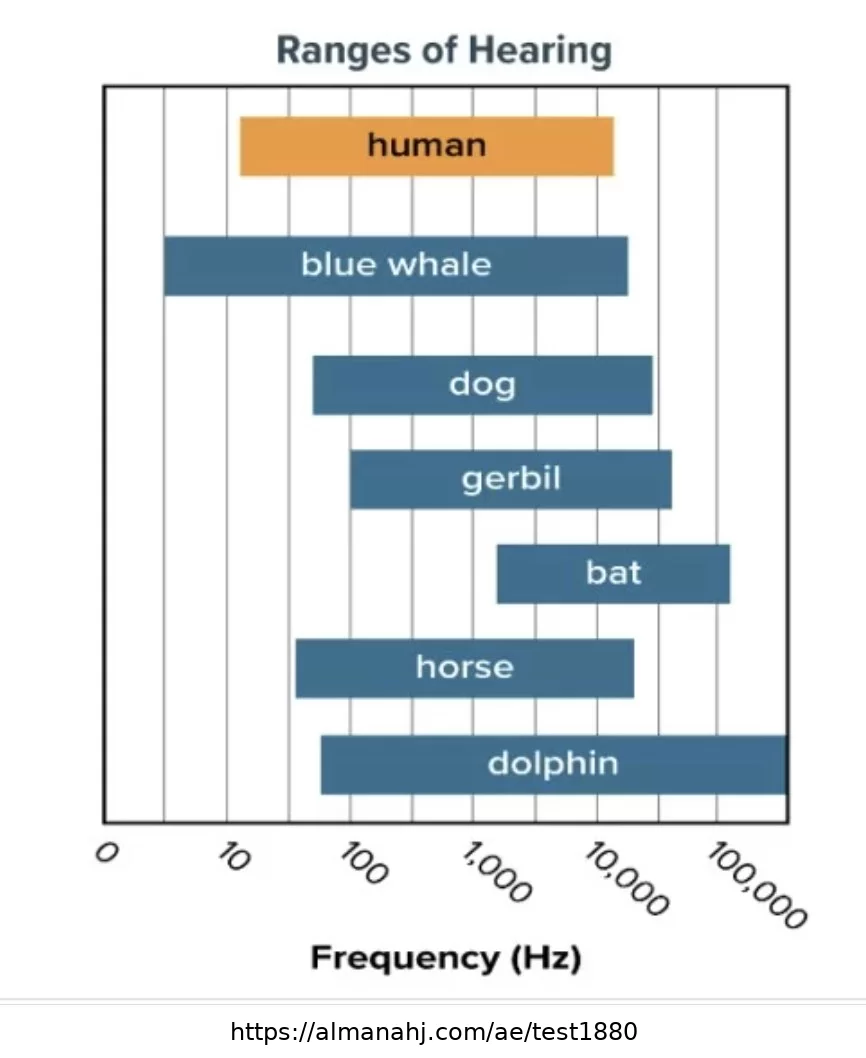
Which animals can hear ultrasound?
Explanation
Ultrasound is sound with frequencies above the human hearing range. Dolphins, bats, dogs, and gerbils can hear ultrasonic frequencies.
Question 19
Points: 1
Which sound has the highest pitch?
Explanation
Pitch increases as frequency increases. Among the choices, 5000 Hz is the highest frequency, so it has the highest pitch.
Question 20
Points: 1
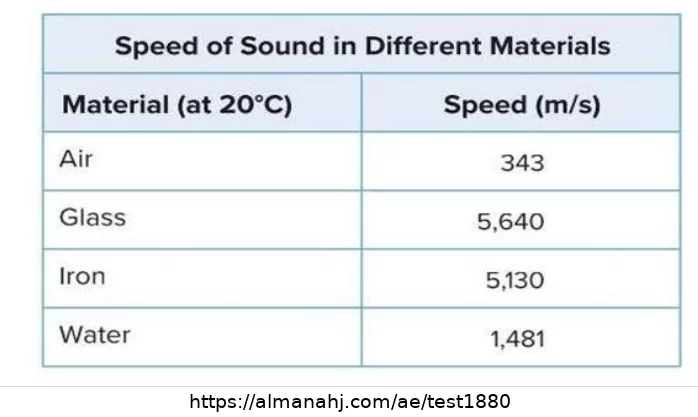
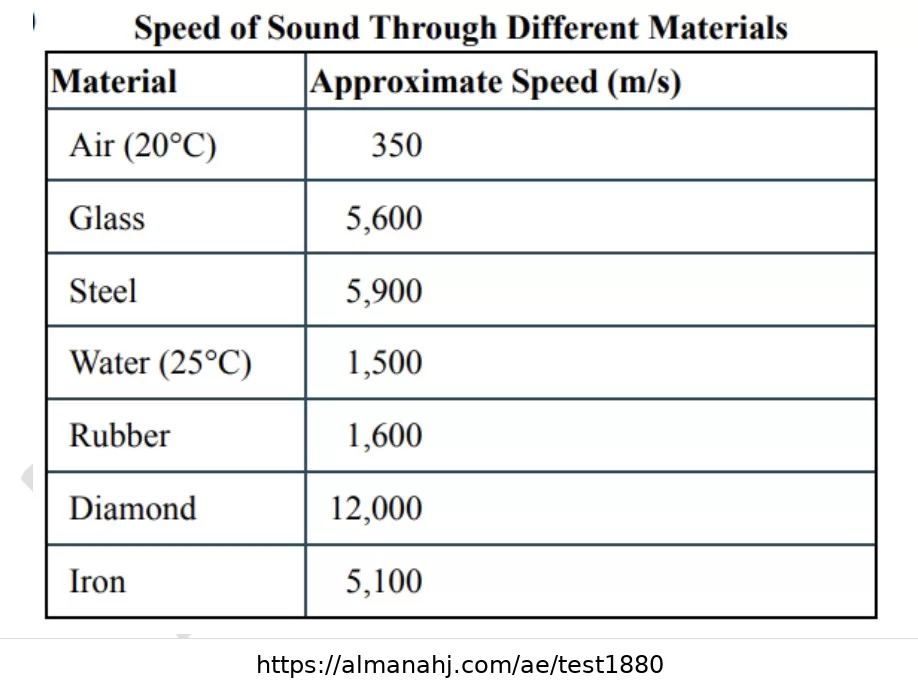
In which of the following does sound travel the slowest?
Explanation
Sound usually travels slowest through gases because particles are farther apart than in liquids and solids.
Question 21
Points: 1
In which of the following does sound travel the fastest?
Explanation
Sound travels fastest in solids because their particles are close together. Iron is a solid, so sound travels fastest through it here.
Question 22
Points: 1
Sound wave takes about 0.02 s to move through a material that is 29.6 m long. What is the material?
Explanation
Speed equals distance divided by time: 29.6 ÷ 0.02 = 1480 m/s. This matches the speed of sound in water.
Question 23
Points: 1
The speed of sound in wood is _____ than the speed of sound in water.
Explanation
Sound generally travels faster in solids such as wood than in liquids such as water.
Question 24
Points: 1
What conclusion can you draw from the information shown in the figure?
Explanation
The table lists different speeds for sound in different materials, so the speed of sound depends on the material.
Question 25
Points: 1
Based on the figure shown, sound waves travel most slowly through which of the following?
Explanation
The table shows that sound travels slowest in air compared with the other listed materials.
Question 26
Points: 1
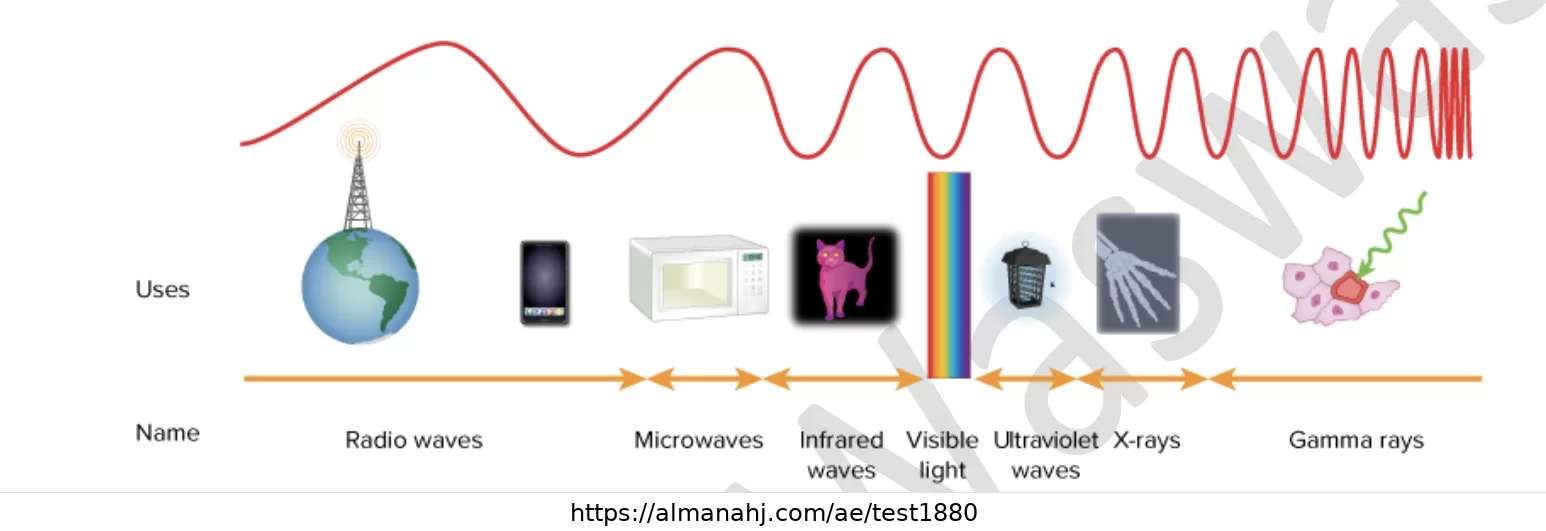
Which statement about visible light is correct?
Explanation
Visible light is the part of the electromagnetic spectrum that can be detected by human eyes.
Question 27
Points: 1
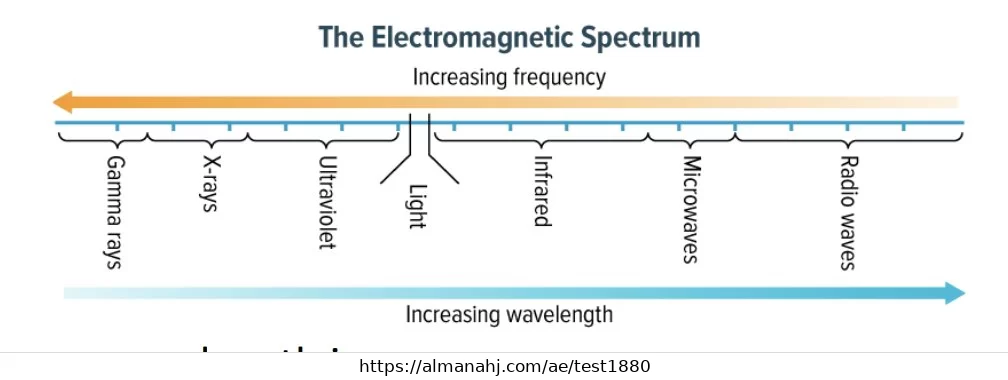
What is the relationship you can conclude between frequency, wavelength, and energy for the electromagnetic radiation shown below?
Explanation
In the electromagnetic spectrum, longer wavelength means lower frequency and lower energy.
Question 28
Points: 1
Why do radio waves have the lowest frequency in the electromagnetic spectrum?
Explanation
Radio waves have the longest wavelengths. Since frequency and wavelength are inversely related, they have the lowest frequency.
Question 29
Points: 1
Which electromagnetic wave has the highest energy?
Explanation
Gamma rays have the highest frequency and therefore the highest energy in the electromagnetic spectrum.
Question 30
Points: 1
What pattern best describes the relationship between wavelength and frequency?
Explanation
Frequency and wavelength are inversely related. When frequency increases, wavelength decreases.
Question 31
Points: 1
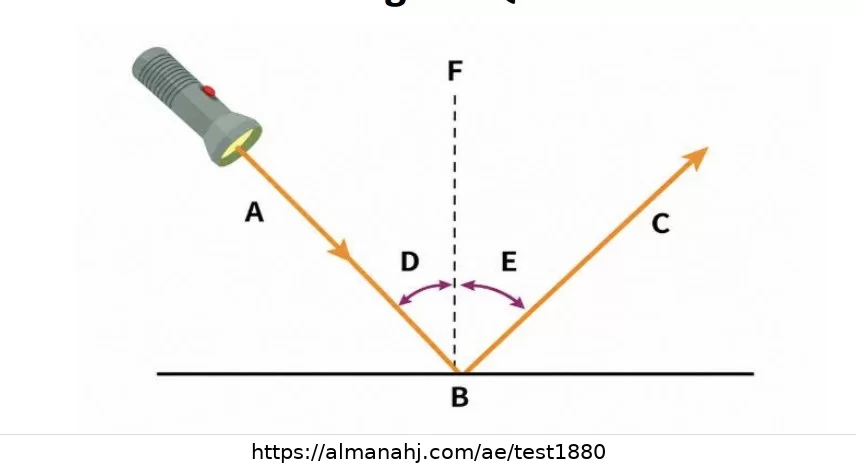
Use the diagram to answer: Which statement correctly identifies the labeled rays in the diagram?
Explanation
In the diagram, ray A approaches the mirror, so it is the incident ray. Ray C leaves the mirror, so it is the reflected ray.
Question 32
Points: 1
Use the diagram to answer: Which pair represents the angle of incidence and the angle of reflection, respectively?
Explanation
The angle of incidence is the angle between the incident ray and the normal, labeled D. The angle of reflection is the angle between the reflected ray and the normal, labeled E.
Question 33
Points: 1
Use the diagram to answer: Which statement correctly identifies the labeled parts in the diagram?
Explanation
B labels the mirror surface, while F labels the normal line drawn perpendicular to the mirror.
Question 34
Points: 1
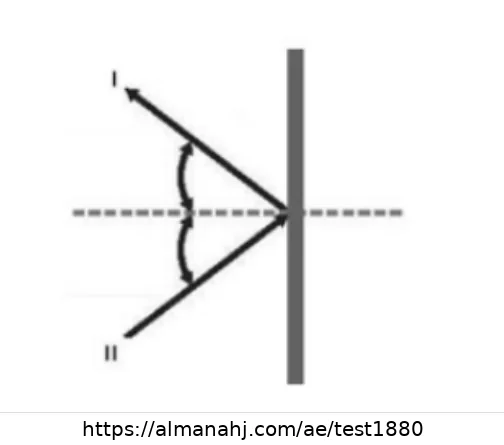
Which is FALSE about the diagram?
Explanation
The normal is the dashed line perpendicular to the mirror. In the diagram, line I is not the normal, so that statement is false.
Question 35
Points: 1
In the figure shown, if angle i is increased, angle r will _____.
Explanation
According to the law of reflection, the angle of incidence equals the angle of reflection. If angle i increases, angle r increases by the same amount.
Question 36
Points: 1
According to the law of reflection, if a light ray strikes a mirror at an angle of incidence of 35°, what is the angle of reflection?
Explanation
The law of reflection states that the angle of incidence equals the angle of reflection, so the angle of reflection is 35°.
Question 37
Points: 1
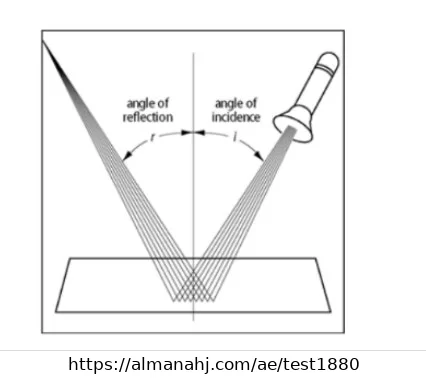
Which statement best describes the law of reflection?
Explanation
The law of reflection states that the angle of incidence is equal to the angle of reflection.
Question 38
Points: 1
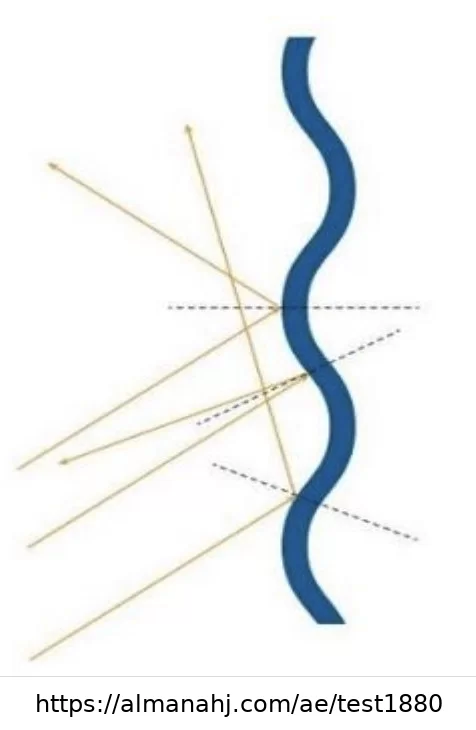
Which object has a surface structure that reflects light rays in the same manner shown in the model?
Explanation
A pond with ripples has an uneven surface, so it reflects light in many directions like the model of diffuse reflection.
Question 39
Points: 1
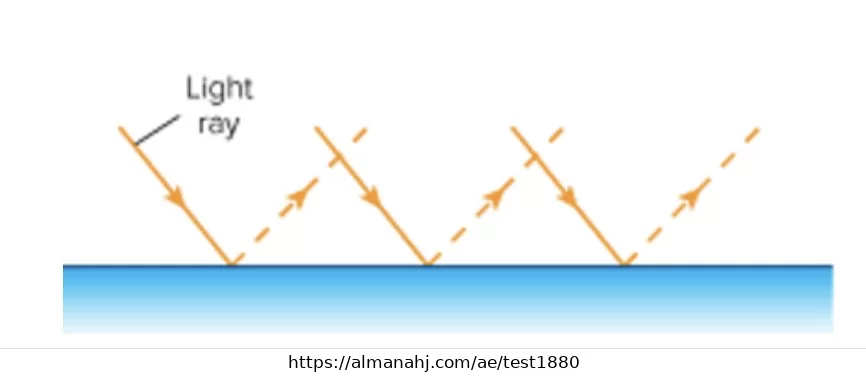
What type of reflection is modeled in the diagram?
Explanation
The diagram shows light reflecting in different directions from an uneven surface, which is diffuse reflection.
Question 40
Points: 1
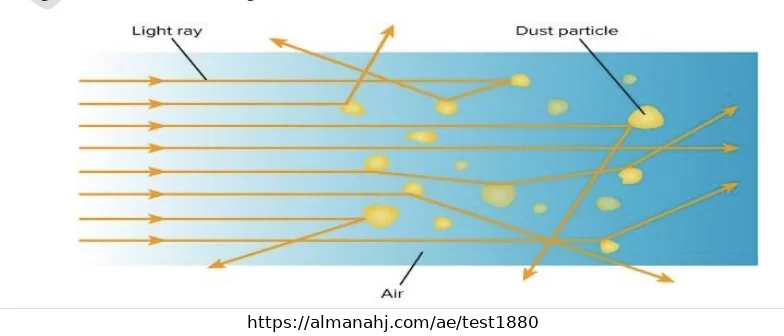
Which behavior of light is shown when light rays hit dust particles in the air?
Explanation
Dust particles cause light to spread in different directions. This behavior is called scattering.
Question 41
Points: 1
Which type of reflection occurs when light rays reflect from a smooth surface in the same direction?
Explanation
A smooth surface reflects parallel rays in the same direction, producing regular reflection.
Question 42
Points: 1
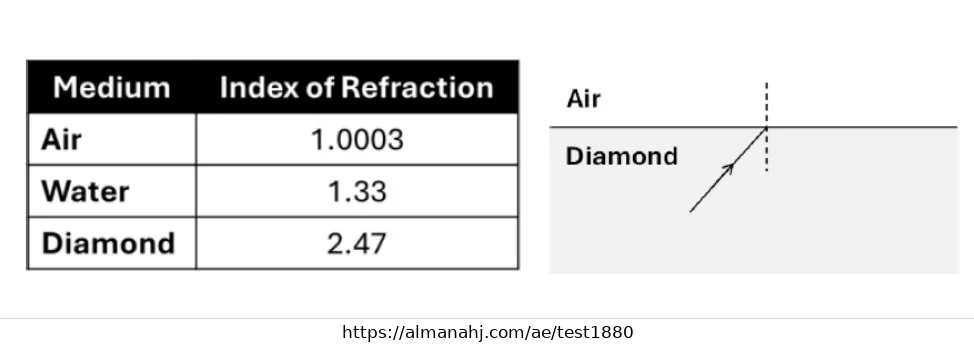
A ray of light travels from a diamond into the air. What happens to the ray?
Explanation
When light moves from a more optically dense medium such as diamond into air, it bends away from the normal.
Question 43
Points: 1
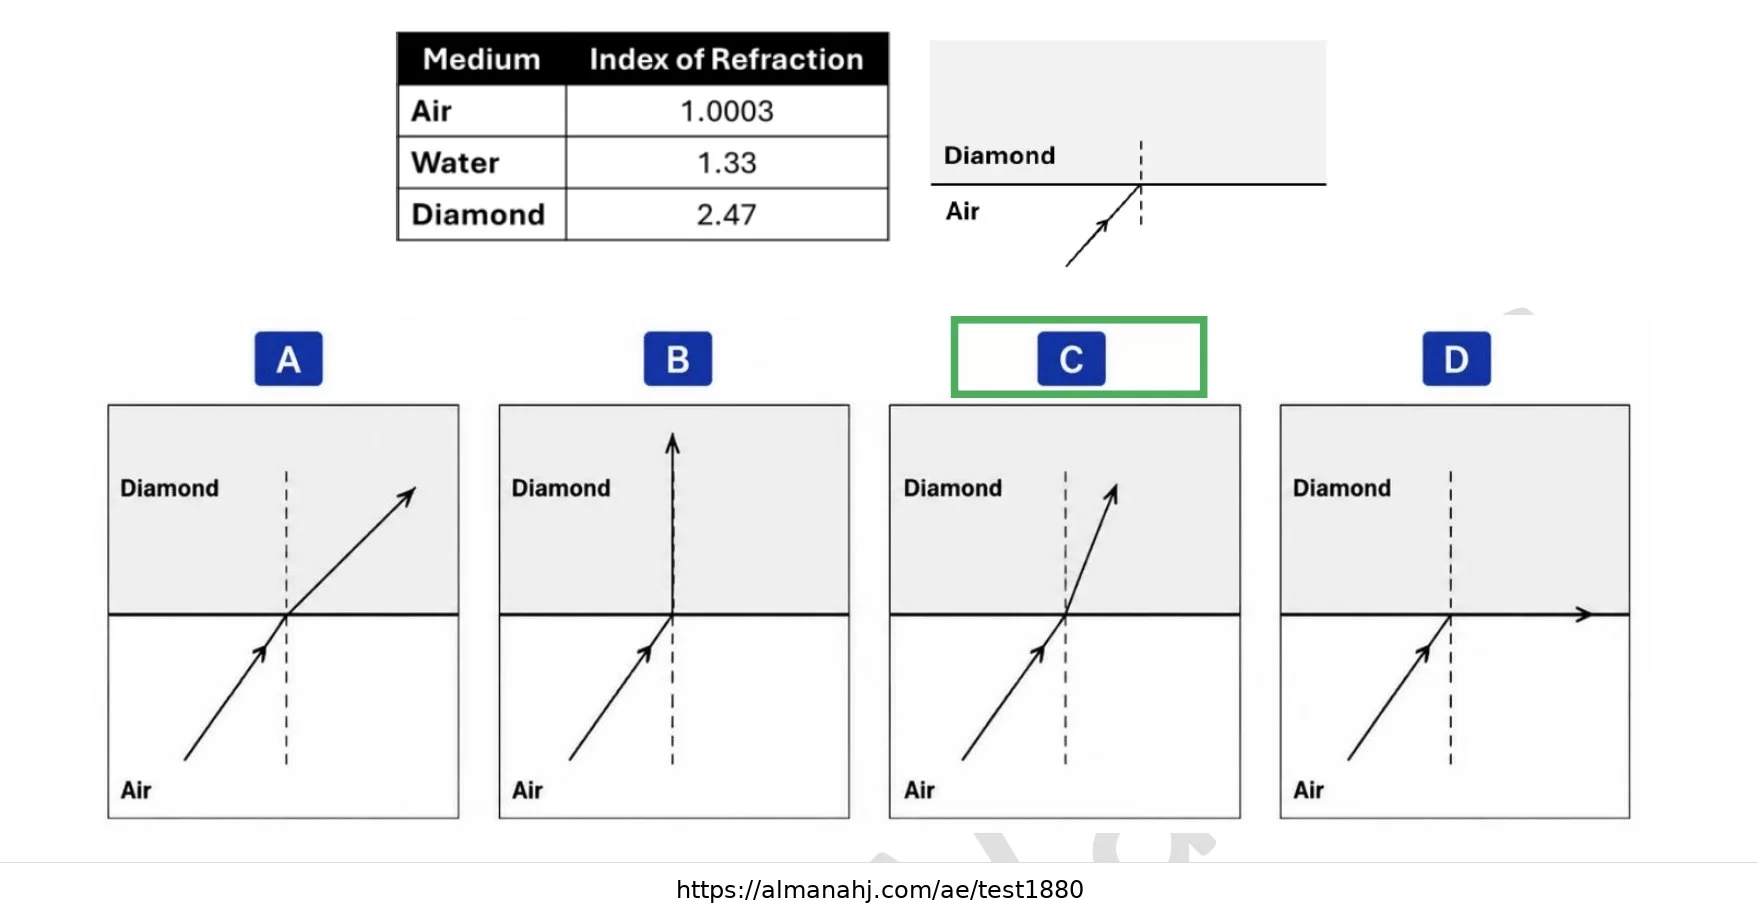
A ray of light travels from air into a diamond. Which diagram correctly shows the path of the refracted ray?
Explanation
When light enters diamond from air, it slows down and bends toward the normal. Diagram C shows this path correctly.
Question 44
Points: 1
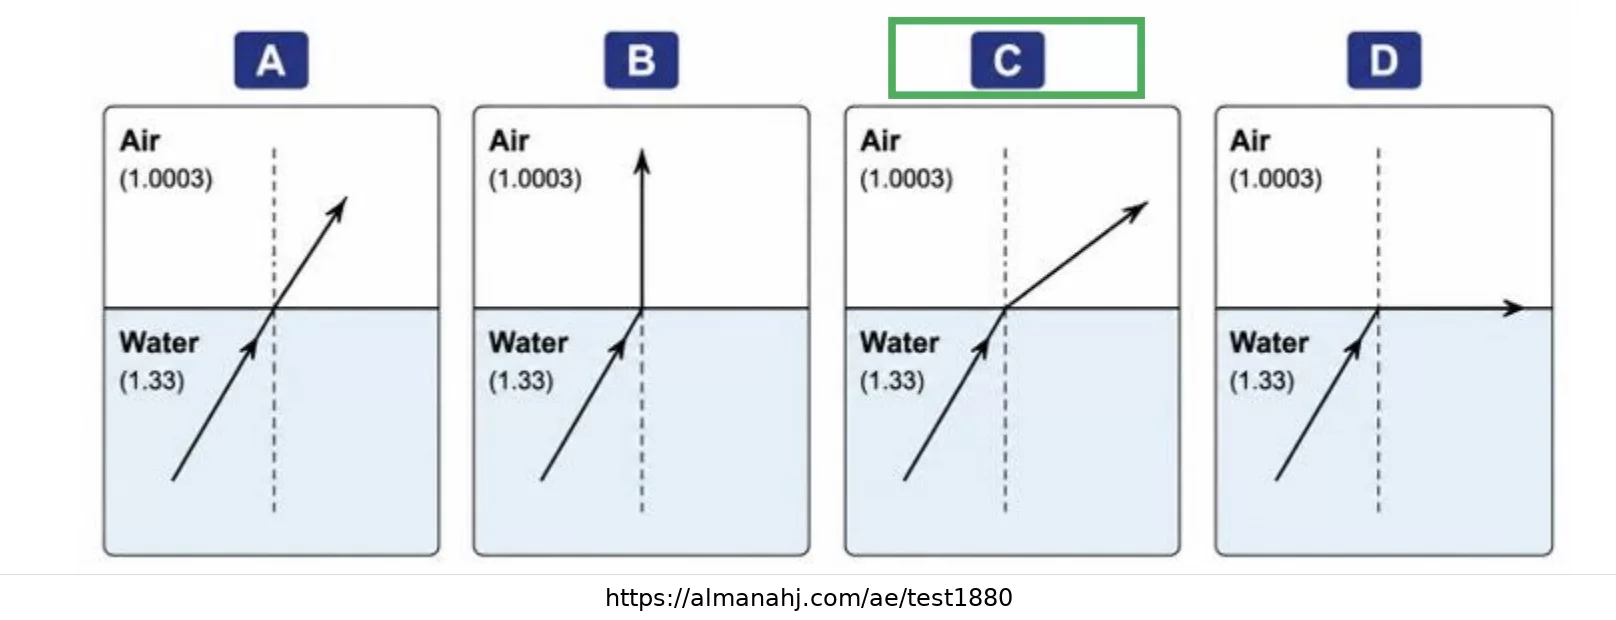
A ray of light travels from water into air as shown. Which diagram correctly shows the path of the refracted ray?
Explanation
When light travels from water into air, it speeds up and bends away from the normal. Diagram C shows this correctly.
Question 45
Points: 1
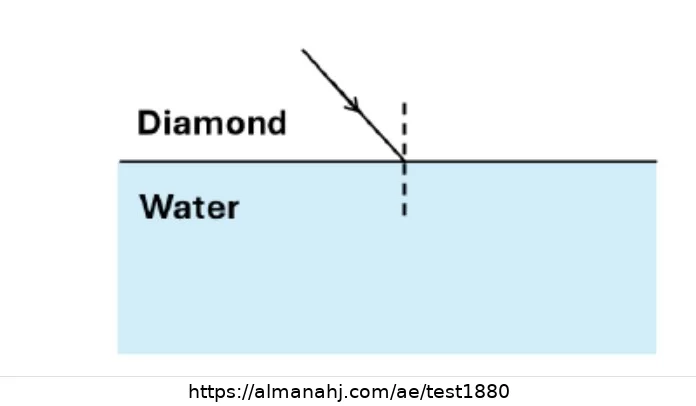
A ray of light travels from a diamond into water. Which diagram correctly shows the path of the refracted ray?
Explanation
Diamond has a higher index of refraction than water. When light moves from diamond to water, it bends away from the normal.
Question 46
Points: 1
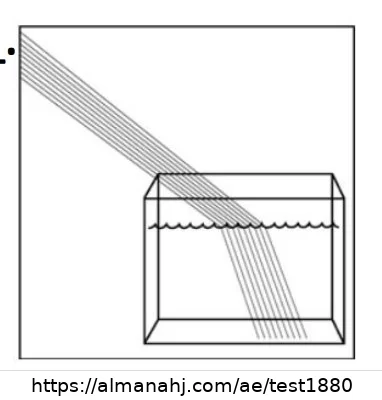
In the figure shown, the light waves change direction as a result of __.
Explanation
Refraction is the bending of light as it passes from one medium to another.
Question 47
Points: 1
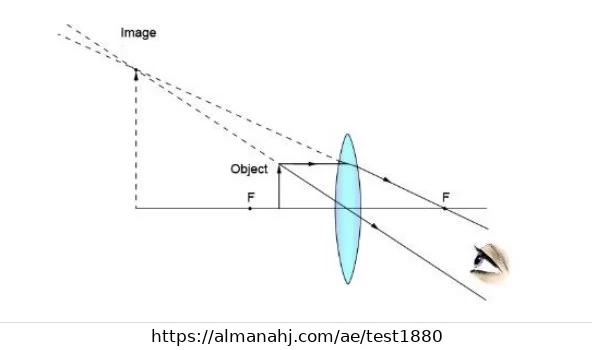
Based on the ray diagram shown, what are the characteristics of the image formed by the convex lens?
Explanation
In the diagram, the object is inside the focal length of the convex lens, so the image is virtual, upright, and larger than the object.
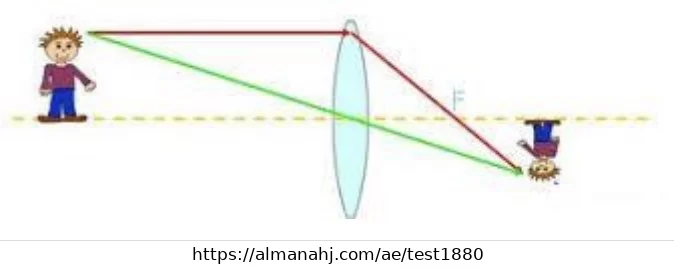
Question 48
Points: 1
Based on the ray diagram shown, what are the characteristics of the image formed by the convex lens?
Explanation
The ray diagram shows the rays meeting on the opposite side of the lens, forming a real, inverted, smaller image.
Question 49
Points: 1
Which of the following statements best explains why a concave lens cannot be used to start a fire?
Explanation
A concave lens spreads, or diverges, light rays. It does not focus the Sun's light to a point, so it cannot start a fire this way.
Question 50
Points: 1
Which statement correctly identifies the objects shown in the figures?
Explanation
Figure 1 is thicker in the middle, so it is a convex lens. Figure 2 is thinner in the middle, so it is a concave lens. Figure 3 is a flat mirror.
Question 51
Points: 1
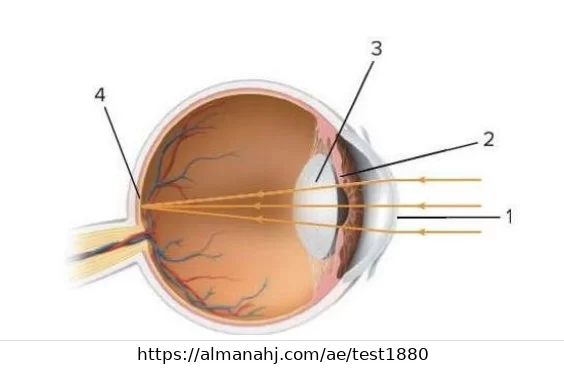
Which part of the eye can change its structure to form a focused image?
Explanation
The lens changes shape to help focus light and form a clear image on the retina. In the diagram, the lens is labeled 3.
Question 52
Points: 1
Use the eye diagram to answer: Which part of the eye can change its shape to help form a focused image on the retina?
Explanation
The lens changes shape to focus light rays onto the retina.
Question 53
Points: 1
Use the eye diagram to answer: On which part of the eye is the image formed?
Explanation
The retina is the light-sensitive layer where the image is formed.
Question 54
Points: 1
Use the eye diagram to answer: Which part of the eye relaxes and contracts to control the amount of light entering the eye?
Explanation
The iris controls the size of the pupil, which controls how much light enters the eye.
Question 55
Points: 1
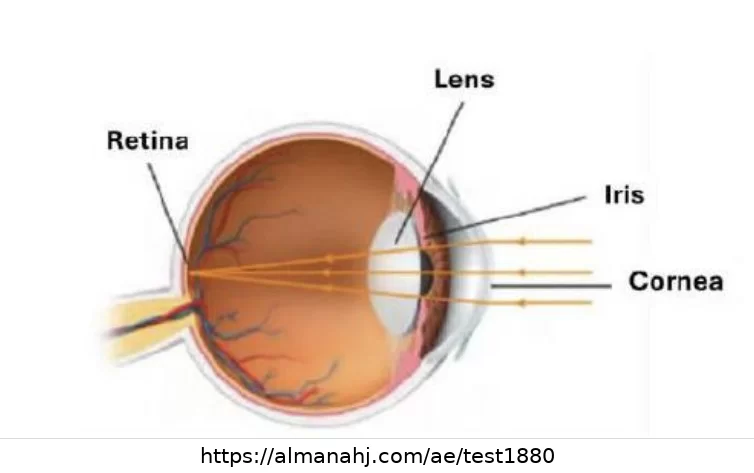
Use the eye diagram to answer: Which part of the eye is a transparent tissue layer that changes the direction of light rays as they enter the eye?
Explanation
The cornea is a transparent layer that refracts light as it enters the eye.
Question 56
Points: 1
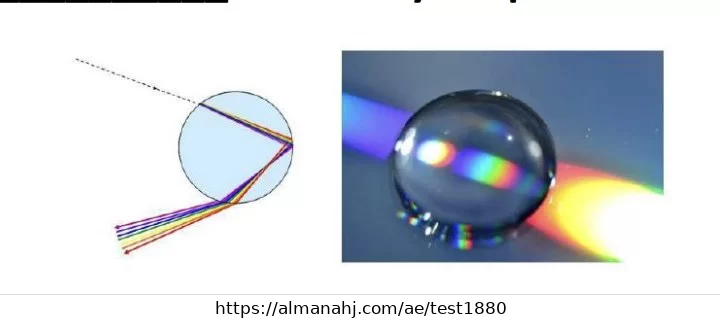
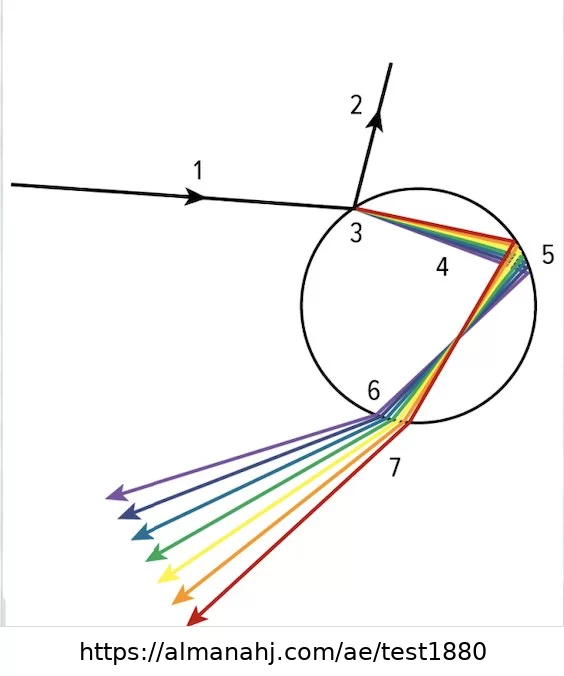
Rainbows form due to __________ caused by droplets of water.
Explanation
Rainbows form when sunlight is refracted and reflected inside water droplets, separating white light into colors.
Question 57
Points: 1
Use the diagram to answer: What caused the spread of the colors at point 7?
Explanation
At point 7, light changes direction as it exits the droplet, causing the colors to spread out. This is refraction.
Question 58
Points: 1
Use the diagram to answer: What colors of light make up ray 1?
Explanation
Ray 1 is incoming white light, and white light is made of all the visible colors.
Question 59
Points: 1
Use the diagram to answer: What produced the light represented by ray 2?
Explanation
Ray 2 is shown leaving the droplet after bouncing off the inside surface, so it was reflected from the drop.
Question 60
Points: 1
A red ball reflects which of the following colors of light?
Explanation
An object appears red because it reflects red light and absorbs most other colors.
Question 61
Points: 1
Which of the following statements about a blue ball is correct?
Explanation
A blue object appears blue because it reflects blue light and absorbs most other colors.
Question 62
Points: 1
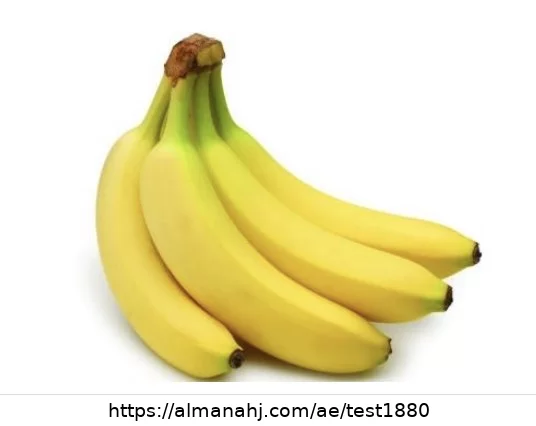
Which color of light does a yellow banana reflect?
Explanation
A yellow banana appears yellow because it reflects yellow light.
Question 63
Points: 1
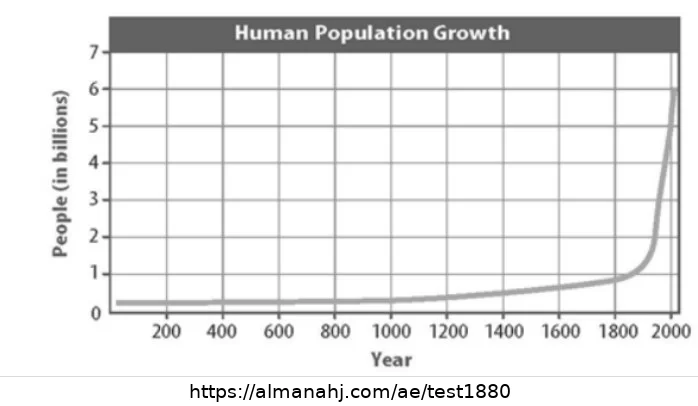
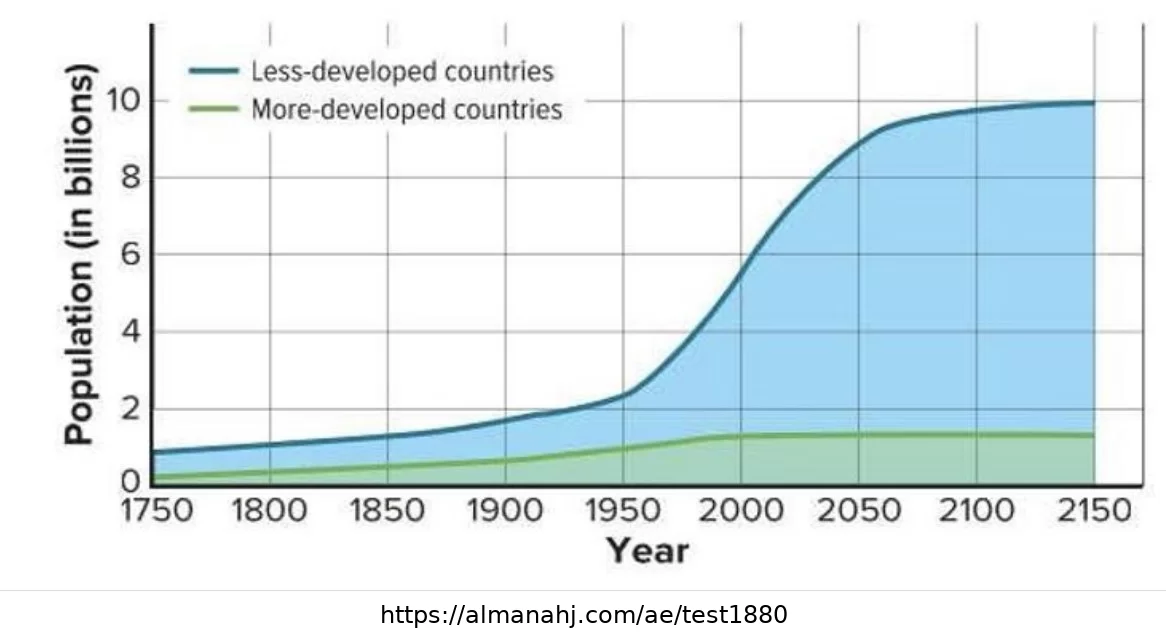
Which of the following does not help explain the sudden rise in population that occurs from the late 1700s and beyond?
Explanation
The Industrial Revolution, scientific advances, and medical advances helped population grow rapidly. The settling of new American towns was not a main global cause.
Question 64
Points: 1
Which of the following helped cause the rapid increase in the human population after the late 1700s?
Explanation
Industrial, scientific, and medical advances all helped improve survival and support rapid population growth.
Question 65
Points: 1
Population explosion refers to the _____.
Explanation
A population explosion means a very rapid increase in population growth rate.
Question 66
Points: 1
A population is ________.
Explanation
A population is a group of individuals of the same species that live in the same area.
Question 67
Points: 1
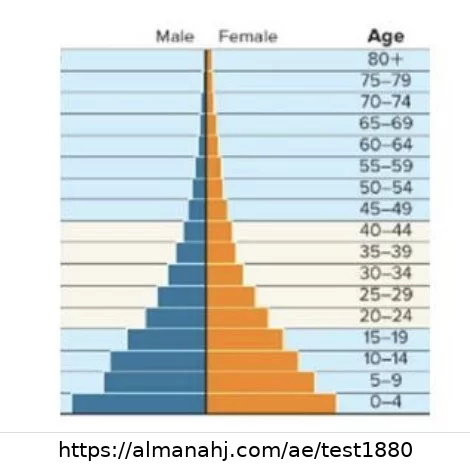
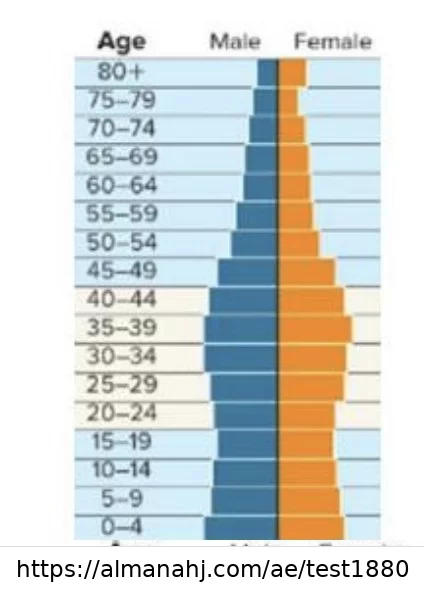
What type of human population growth does the age structure diagram represent?
Explanation
A wide base in an age structure diagram means many young, pre-reproductive individuals, which indicates rapid growth.
Question 68
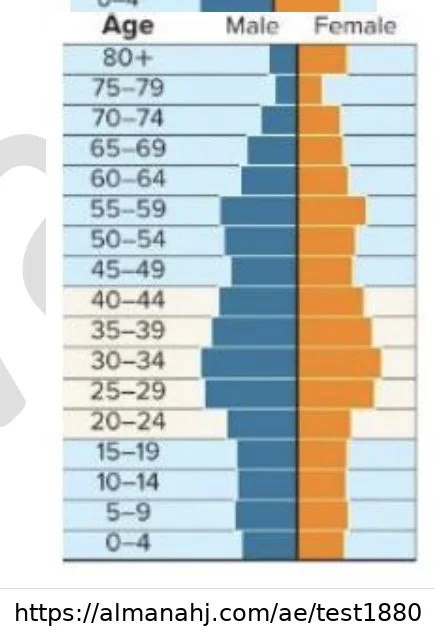
Points: 1
What type of human population growth does the age structure diagram represent?
Explanation
The diagram has age groups with more similar sizes, which represents slow growth rather than rapid growth.
Question 69
Points: 1
What type of human population growth does the age structure diagram represent?
Explanation
The diagram shows fewer young individuals than adults, which suggests negative growth.
Question 70
Points: 1
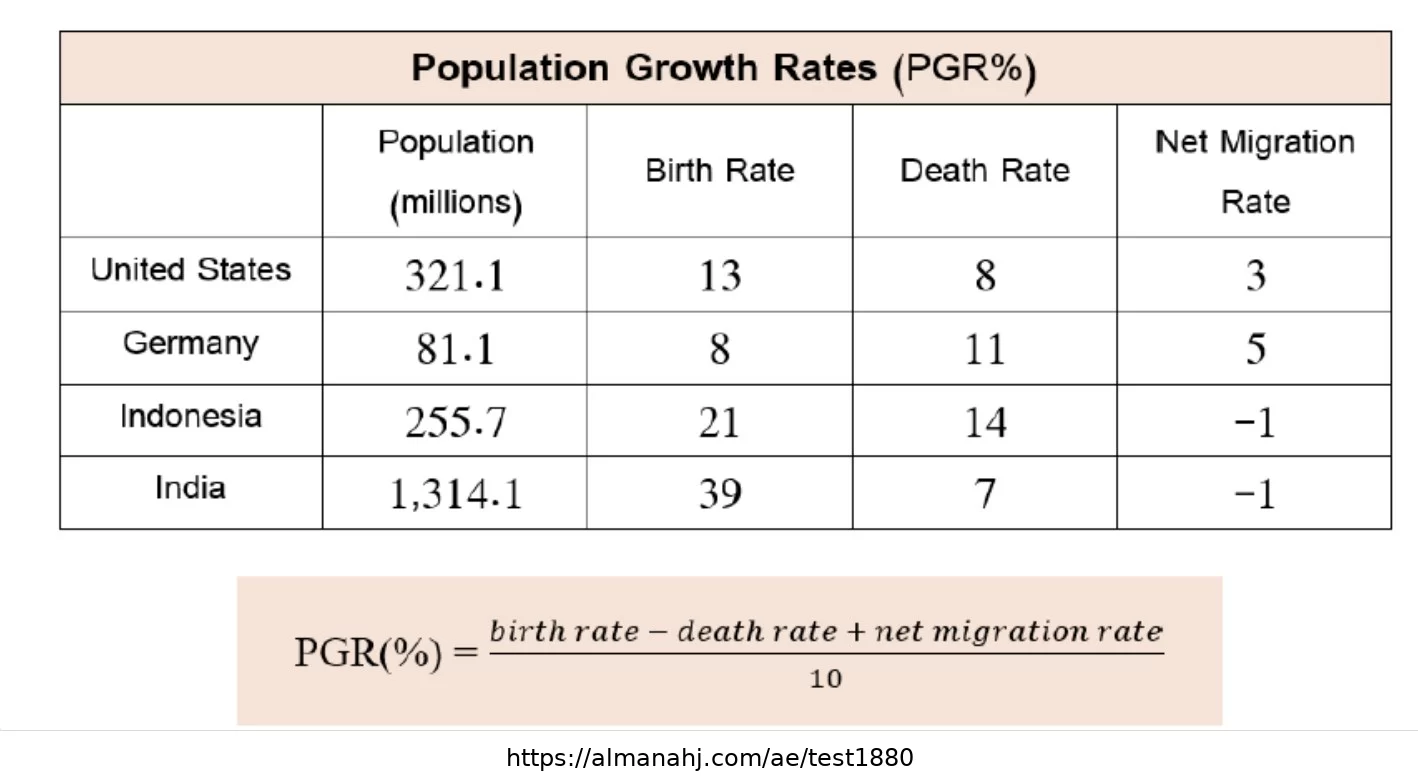
Using the data in the table below, calculate the population growth rate (PGR%) for India.
Explanation
Using the formula PGR% = (birth rate - death rate + net migration rate) / 10, India gives about 3.1%.
Question 71
Points: 1
Using the data in the table, calculate the population growth rate (PGR%) for the USA.
Explanation
Using the formula PGR% = (birth rate - death rate + net migration rate) / 10, the USA gives about 0.8%.
Question 72
Points: 1
When do populations increase?
Explanation
A population increases when more individuals are born than die, so birth rates must be higher than death rates.
Question 73
Points: 1
How do birth rates typically differ between more-developed and less-developed countries?
Explanation
Less-developed countries typically have higher birth rates than more-developed countries.
Question 74
Points: 1
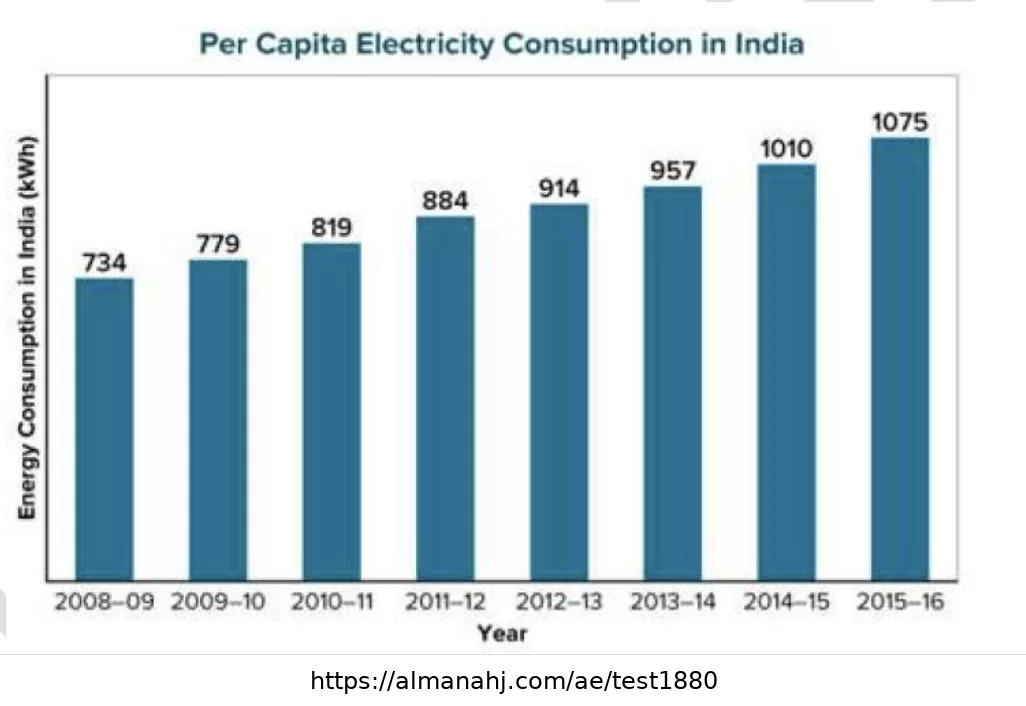
Based on the graph, what can be concluded about India's population?
Explanation
The graph shows electricity use increasing over time, which supports the conclusion that the population increased over time.
Question 75
Points: 1
______________ refers to the largest population an environment can support.
Explanation
Carrying capacity is the largest population that an environment can support with its available resources.
Question 76
Points: 1
In 1960, USA had about 16,000 km of interstate highways. Today, the interstate highway system includes 77,000 km of paved roadways. What percent increase does this represent?
Explanation
The increase is 77,000 - 16,000 = 61,000 km. Percent increase is $61,000 / 16,000 × 100 ≈ 381%$.
Question 77
Points: 1
The size of the Amazon rainforest in 1970 was around 5.8 million km². In 2020, the size of the rainforest was around 5.2 million km². What is the percent decrease?
Explanation
The decrease is 5.8 - 5.2 = 0.6 million km². Percent decrease is $0.6 / 5.8 × 100 ≈ 10.3%$.
Question 78
Points: 1
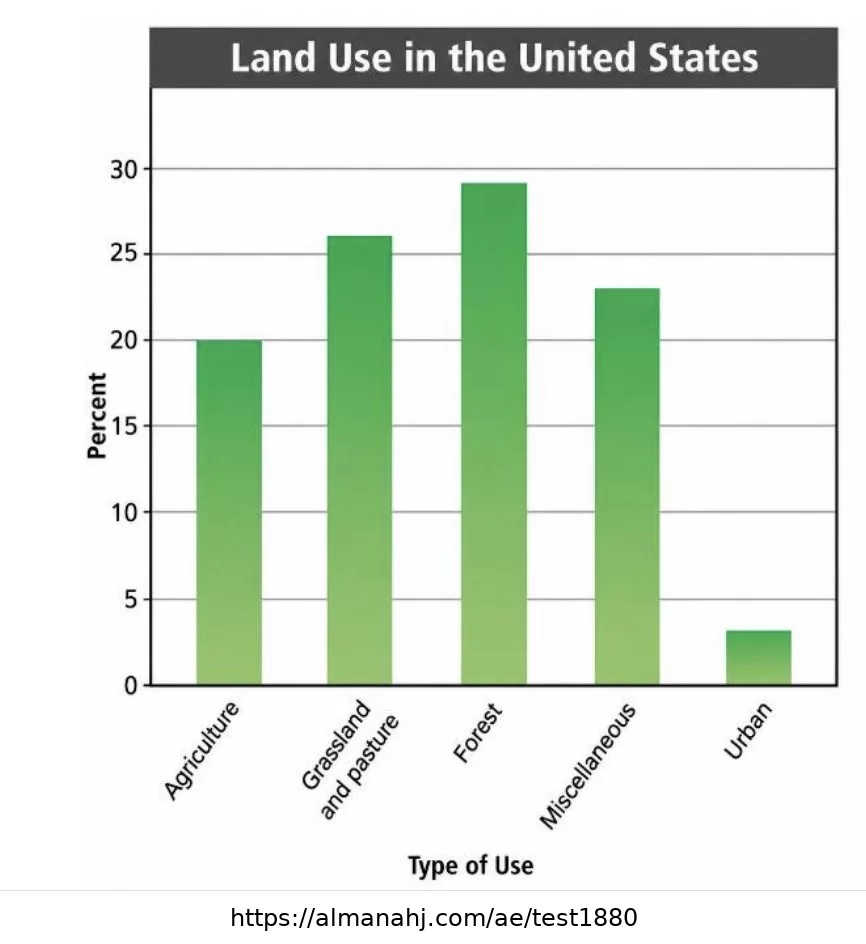
Use the graph to answer: According to the graph, how much land is used by cities compared to other land uses?
Explanation
The urban category is the smallest bar on the graph, so cities use very little land compared with other categories.
Question 79
Points: 1
Use the graph to answer: Which category had the highest percentage of land use in the United States?
Explanation
The forest bar is the tallest on the graph, so it has the highest percentage of land use.
Question 80
Points: 1
Use the graph to answer: Which types of land use were 20% or lower?
Explanation
Agriculture is at 20%, and Urban is below 20%, so these are the land uses that are 20% or lower.
Question 81
Points: 1
Use the graph to answer: Which types of land use were higher than 20%?
Explanation
Grassland and pasture, forest, and miscellaneous are all above 20% on the graph.
Question 82
Points: 1
Which atmospheric gas contributes to climate change?
Explanation
Carbon dioxide is a greenhouse gas that contributes to climate change.
Question 83
Points: 1
Deforestation can lead to ______.
Explanation
Deforestation can destroy habitats, increase soil erosion, and contribute to higher average temperatures.
Question 84
Points: 1
One cause of __________ may be deforestation.
Explanation
Deforestation can increase carbon dioxide in the atmosphere, which can contribute to climate change.
Question 85
Points: 1
Of the following, which helps conserve natural resources?
Explanation
All three actions help reduce resource use or support natural resources, so all of the above is correct.
Question 86
Points: 1
Which of the following is a way a 13-year-old in America can help control greenhouse gases?
Explanation
Planting trees, recycling, and saving electricity can all help reduce greenhouse gases.
Question 87
Points: 1
Which two actions can help reduce an ecological footprint?
Explanation
Increasing forest areas and using hydropower can reduce an ecological footprint.
Question 88
Points: 1
Which TWO actions increase the ecological footprint on the environment?
Explanation
Deforestation and increased use of fossil fuels both increase ecological footprint.
Question 89
Points: 1
Switching to renewable energy resources will lead to ____________.
Explanation
Renewable energy resources usually reduce pollution and the ecological footprint.
Question 90
Points: 1
Which of the following effects is directly linked to deforestation?
Explanation
Removing forests reduces carbon dioxide absorption, which can increase carbon dioxide levels in the atmosphere.
Question 91
Points: 1
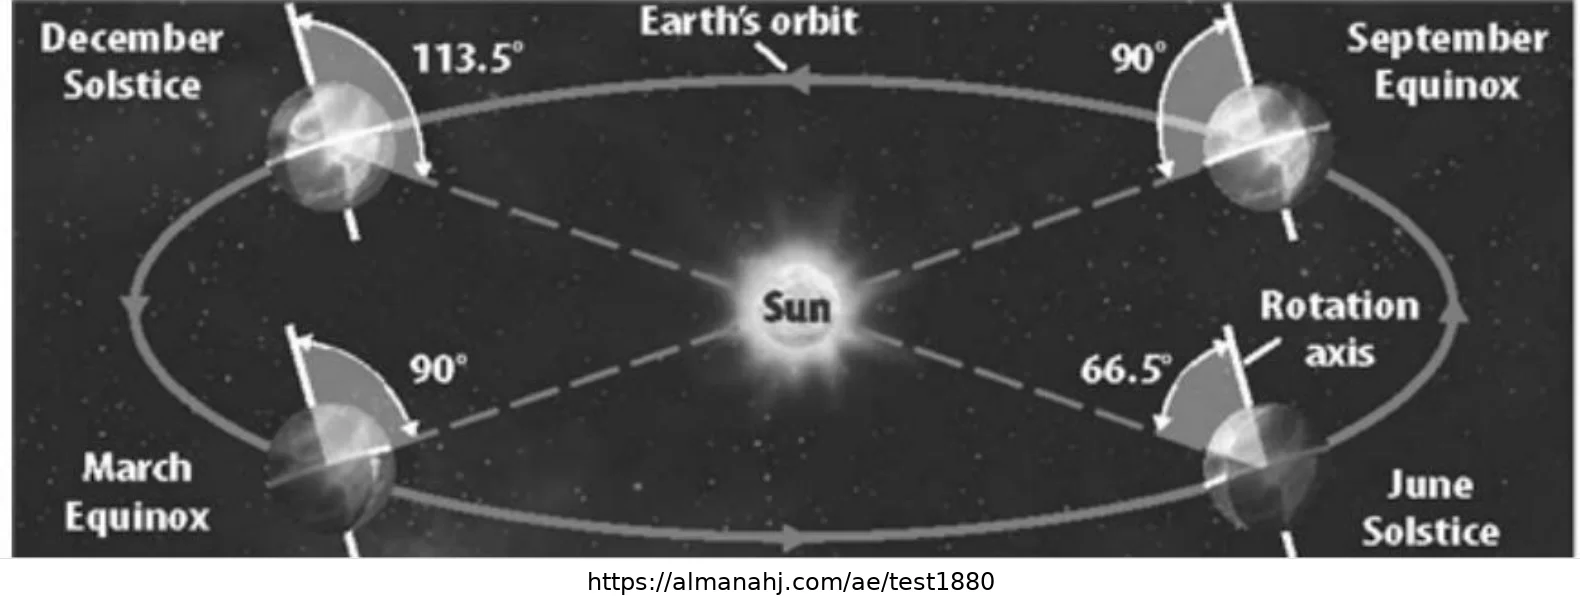
Summer occurs on the hemisphere of Earth that is ______.
Explanation
Summer occurs when a hemisphere is tilted toward the Sun and receives more direct sunlight.
Question 92
Points: 1
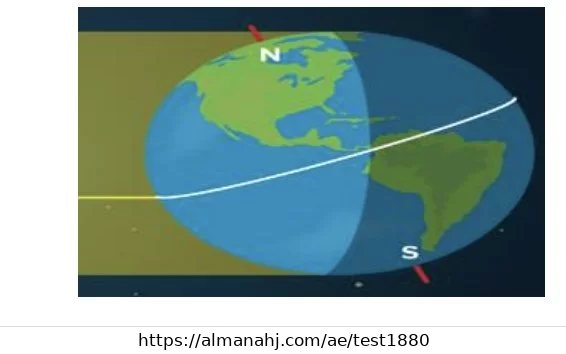
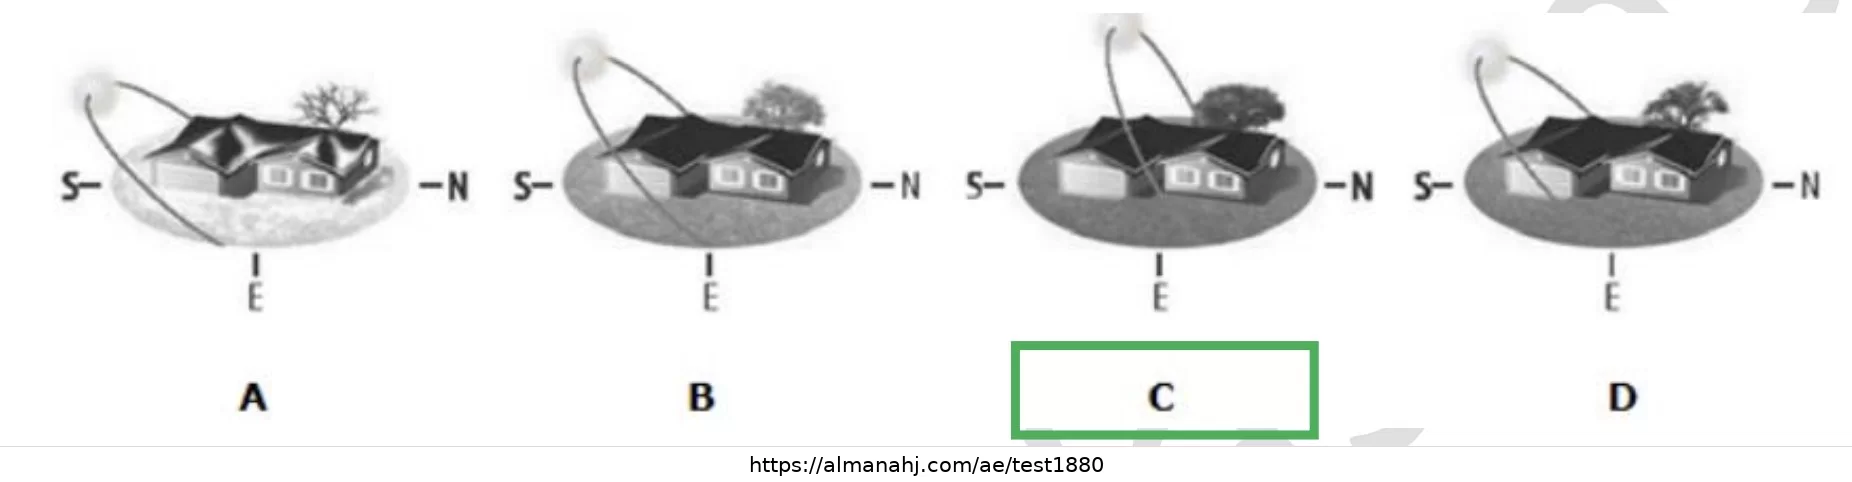
Which of the following would have the most daylight hours?
Explanation
The diagram labeled C shows the location with the greatest amount of daylight.
Question 93
Points: 1
The Sun's rays strike Earth at their northernmost and southernmost positions during __.
Explanation
The Sun's rays reach their farthest north and south points at the solstices.
Question 94
Points: 1
Which statement is true about both the March Equinox and the September Equinox?
Explanation
During equinoxes, day and night are nearly equal, with about 12 hours of daylight and 12 hours of darkness.
Question 95
Points: 1
A solstice is a day when ______.
Explanation
A solstice occurs when a hemisphere is tilted most toward the Sun or most away from the Sun, depending on the season.
Question 96
Points: 1
The seasons are caused by ______.
Explanation
Seasons happen because Earth's axis is tilted as Earth orbits the Sun, changing the angle and length of sunlight.
Question 97
Points: 1
A new moon occurs once every 29.5 days. Why must the Sun, Earth, and the Moon be aligned in order for the new moon to occur?
Explanation
At new moon, the Moon is between the Sun and Earth, so the side facing Earth is dark and sunlight toward Earth is blocked by the Moon.
Question 98
Points: 1
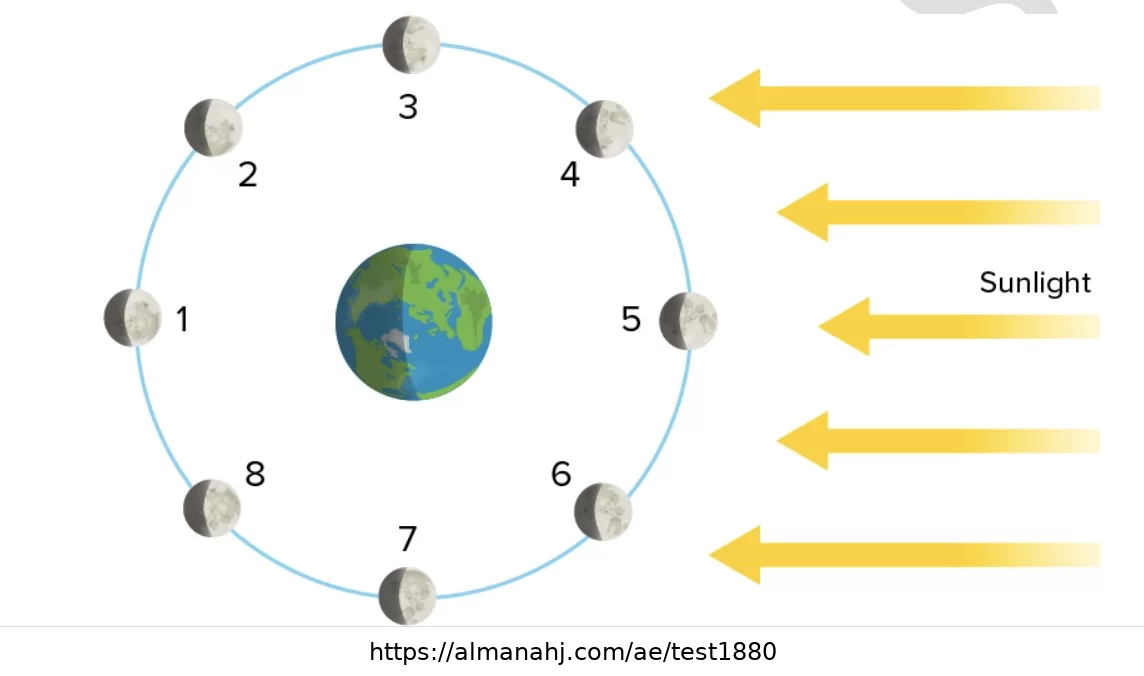
Use the Moon phase diagram to answer: Predict the locations when the Moon is in a waxing phase.
Explanation
Waxing phases occur after the new moon and before the full moon. In the diagram, these are locations 2, 3, and 4.
Question 99
Points: 1
Use the Moon phase diagram to answer: Predict the locations when the Moon is in a waning phase.
Explanation
Waning phases occur after the full moon and before the next new moon. In the diagram, these are locations 6, 7, and 8.
Question 100
Points: 1
Use the Moon phase diagram to answer: Predict which location is the phase seen from Earth at the end of the second week of the lunar cycle.
Explanation
At the end of the second week, the Moon is around the full moon phase, shown at location 1 in the diagram.
Question 101
Points: 1
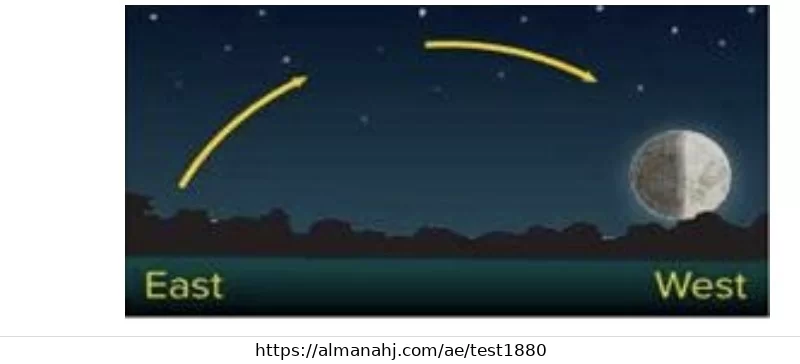
Which phase of the Moon is shown in this picture of the sky at midnight?
Explanation
The highlighted diagram indicates the first quarter phase.
Question 102
Points: 1
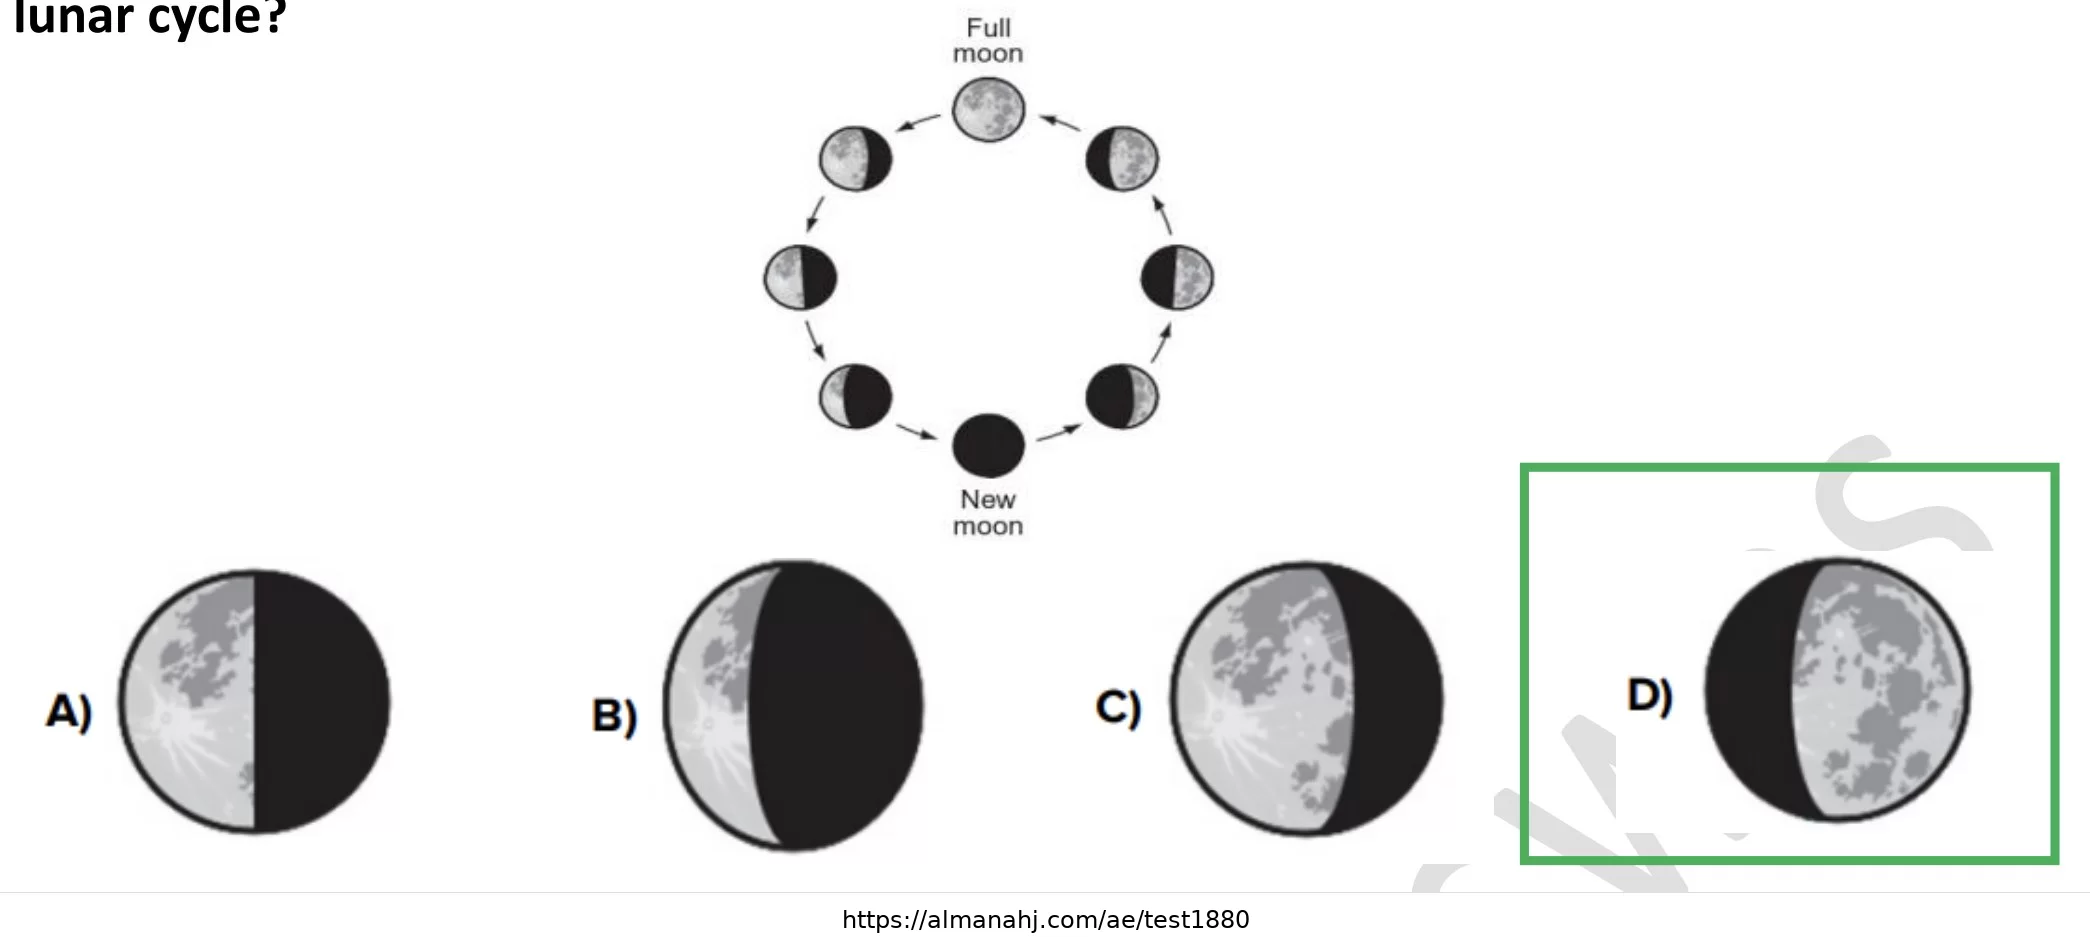
Which phase of the Moon can you most likely observe on the eleventh night of this lunar cycle?
Explanation
The eleventh night is between first quarter and full moon, so the Moon is in a waxing gibbous phase. Option D shows this phase.
Question 103
Points: 1
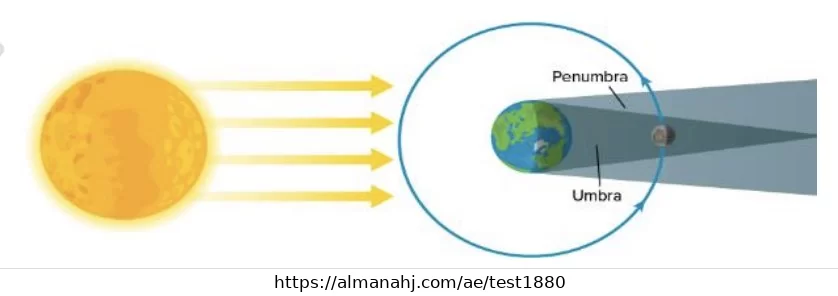
What is occurring in this figure?
Explanation
The Moon is between the Sun and Earth and casts a shadow on Earth, which is a solar eclipse.
Question 104
Points: 1
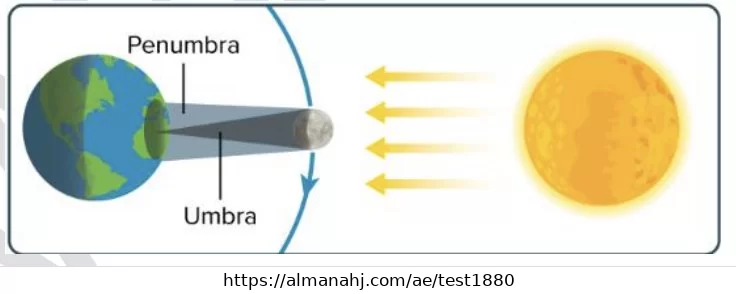
What is occurring in this figure?
Explanation
Earth is between the Sun and the Moon and casts its shadow on the Moon, which is a lunar eclipse.
Question 105
Points: 1
A lunar eclipse can only occur during which type of moon phase?
Explanation
A lunar eclipse can occur only during a full moon, when Earth is between the Sun and the Moon.
Question 106
Points: 1
A lunar eclipse occurs when ______.
Explanation
A lunar eclipse occurs when Earth is between the Sun and the Moon and Earth’s shadow falls on the Moon.
Result Tracking
Answered0 / 106
Correct Answers0
Wrong Answers0
Current Percentage0%
Quiz Completed
This is your final result after answering all questions.
Final Result
0/1060%
Correct Answers0
Wrong Answers0
Answered Questions0 / 106
Total Possible Points106
You can reopen the page to start again.
يمكنك تسجيل الدخول لحفظ سجل محاولاتك، معرفة أخطائك المتكررة، والحصول على نصائح مخصصة. تسجيل الدخول باستخدام Google
Here are more quizzes for الصف الثامن by الفصل الثالث and subject علوم
This section is rendered only when the user reaches it while scrolling.
...
🍪
إشعار ملفات تعريف الارتباط
يستخدم هذا الموقع ملفات تعريف الارتباط لتحسين تجربة التصفح وقياس الأداء وعرض المحتوى بشكل أفضل.
باستخدامك للموقع فإنك توافق على استخدامنا لها وفق
سياسة الخصوصية.