Question 1
DB question no.: 1
Points: 1
The scatter plot shows the number of girls that participated in high school sports. Write an equation in slope-intercept form for the line of fit that is drawn. Then interpret the slope and y-intercept.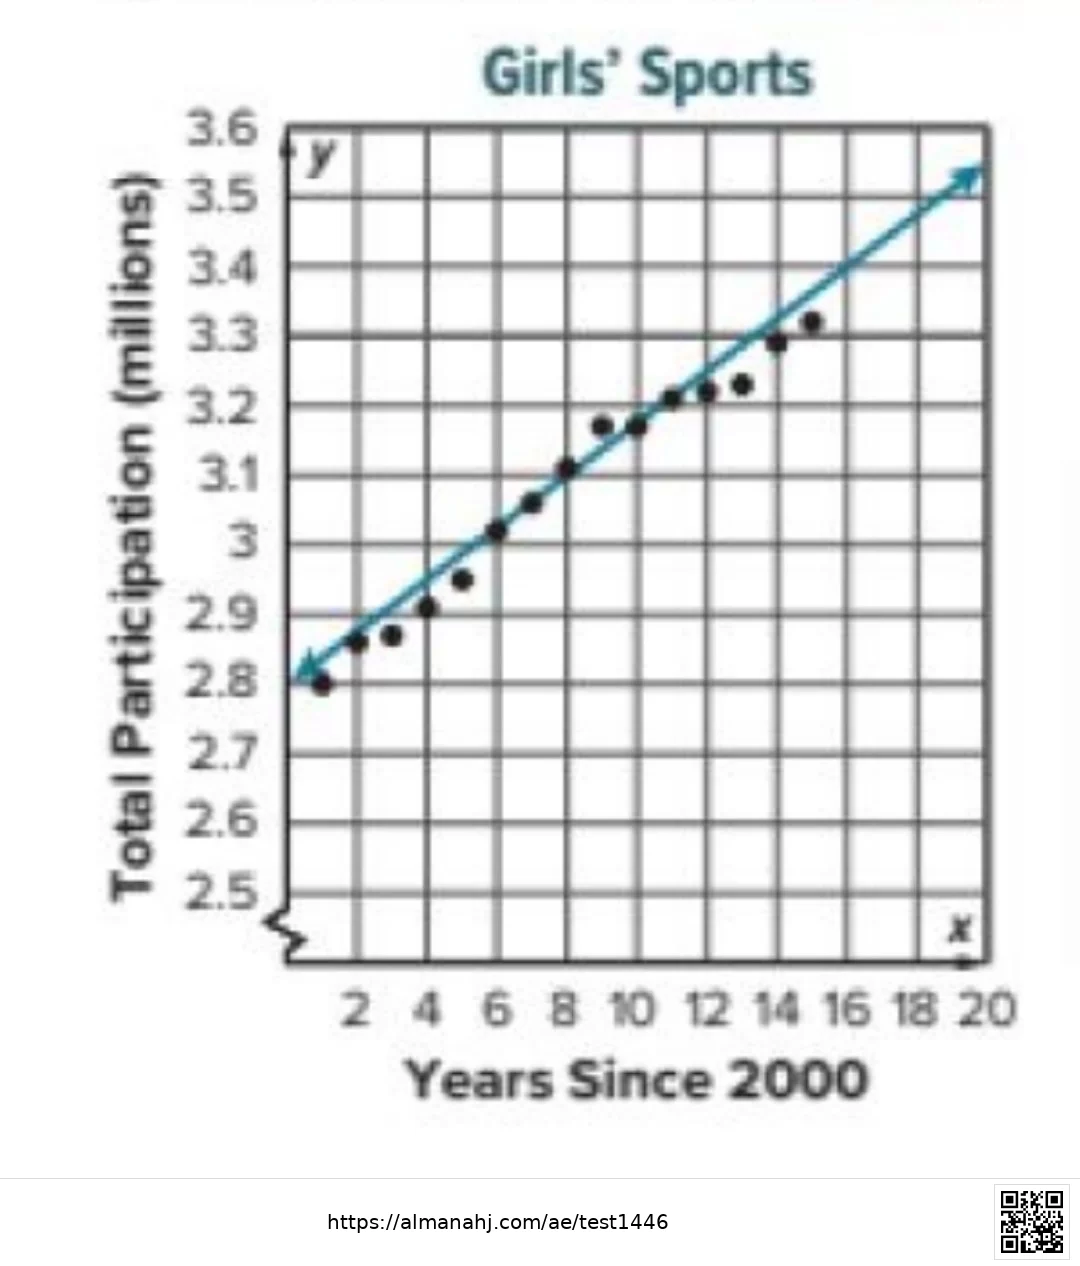
Explanation
Looking at the graph, the line crosses the y-axis at 2.8. Choosing a point like (20, 3.3), the slope is (3.3 - 2.8) / (20 - 0) = 0.5 / 20 = 0.025. Therefore, the equation is y = 0.025x + 2.8.