موقع المناهج
>>
المناهج الإماراتية
المناهج السعودية
المناهج الكويتية
المناهج القطرية
المناهج العمانية
المناهج البحرينية
المناهج السورية
>>
اختر صفًا
الصف الأول
الصف الثاني
الصف الثالث
الصف الرابع
الصف الخامس
الصف السادس
الصف السابع
الصف الثامن
الصف التاسع العام
الصف العاشر العام
الصف الحادي عشر العام
الصف الثاني عشر العام
الصف العاشر المتقدم
الصف الحادي عشر المتقدم
الصف الثاني عشر المتقدم
الصف التاسع المتقدم
الصف العاشر
الصف الحادي عشر
الصف الثاني عشر
الصف التاسع
KG1
KG2
مرحلة ابتدائية
مرحلة متوسطة
مرحلة ثانوية
ملفات جامعية
أخبار
ملفات مدرسية
Interactive multiple-choice quiz: Graphing Polynomial Functions - Reveal
Exploring Polynomial Functions through Graphs: Understanding End Behavior and Extrema. This guide focuses on identifying key features of polynomial functions, including relative maximum and minimum points, intervals where the function is increasing or decreasing, and the end behavior as x approaches positive or negative infinity. By analyzing the degree and the leading coefficient, we can predict whether the graph's ends point in the same or opposite directions, helping to visualize the overall structure of the polynomial.
🏆 انضم إلى التحدي واحصل على ترتيبك
اختبار شهادة تدريبي مؤقت للصف والمادة والفصل نفسه.
ابدأ السباق ✨
🎮 جرّب اجتياز الاختبار عبر الألعاب!
حوّل أسئلة الاختبار إلى تحديات وألعاب تعليمية ممتعة.
🎯 ابدأ اللعب الآن
اختر إجابة واحدة لكل سؤال. عند الاختيار ستظهر النتيجة فورًا: الأخضر صحيح، والأحمر خطأ، وسيظهر تفسير الإجابة مباشرة إن كان متوفرًا. وبعد آخر سؤال ستظهر الدرجة النهائية تلقائيًا.
🚩 Report
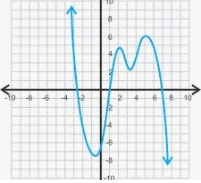
What is the relative maximum?
Explanation
Based on the graph, the point where the curve reaches its local peak before turning back down is (2,0).
🚩 Report
What is the relative minimum?
Explanation
The relative minimum is the local valley of the graph, which occurs at the coordinate (4.67, -9.48).
🚩 Report
As \(x \to \infty, f(x) \to \)
A
\(\infty\)
B
\(-\infty\)
Explanation
As the x-values increase (moving to the right), the graph continues to rise upward toward positive infinity.
🚩 Report
As \(x \to -\infty, f(x) \to \)
A
\(\infty\)
B
\(-\infty\)
Explanation
As the x-values decrease (moving to the left), the graph continues to fall downward toward negative infinity.
🚩 Report
Increasing Interval(s): (Choose all that apply)
A
\((-\infty, 2)\)
B
(2, -4.67)
C
\((-\infty, 0)\)
D
(0, -9.48)
Explanation
The function is increasing as it moves upward from the left until it reaches the relative maximum at x = 2.
🚩 Report
Decreasing Interval(s): (Choose all that apply)
A
\((-\infty, 2)\)
B
(2, -4.67)
C
\((-4.67, \infty)\)
D
\((-\infty, 0)\)
Explanation
The function is decreasing as it moves downward between the relative maximum at x = 2 and the relative minimum at x = 4.67.
🚩 Report
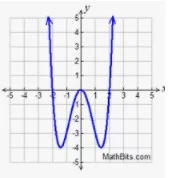
Choose all that apply for the graph shown:
A
Even Degree
B
Odd Degree
C
Negative Leading Coefficient
Explanation
The graph points in the same direction (up) on both ends, which indicates an even degree.
🚩 Report
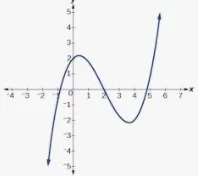
Choose all that apply for the graph shown:
A
Even Degree
B
Odd Degree
C
Positive Leading Coefficient
Explanation
The ends of the graph point in opposite directions, which indicates an odd degree.
🚩 Report
Choose all that apply for the graph shown:
A
Even Degree
B
Odd Degree
C
Negative Leading Coefficient
Explanation
The graph rises on the right and falls on the left, which indicates an odd degree polynomial with a positive leading coefficient.
🚩 Report
Describe the end behavior of a 15th degree polynomial with a positive leading coefficient. Choose all that apply.
A
As \(x \to \infty, f(x) \to \infty\)
B
As \(x \to \infty, f(x) \to -\infty\)
C
As \(x \to -\infty, f(x) \to \infty\)
Explanation
A polynomial with an odd degree (15) and a positive leading coefficient will always rise as x approaches positive infinity.
🚩 Report
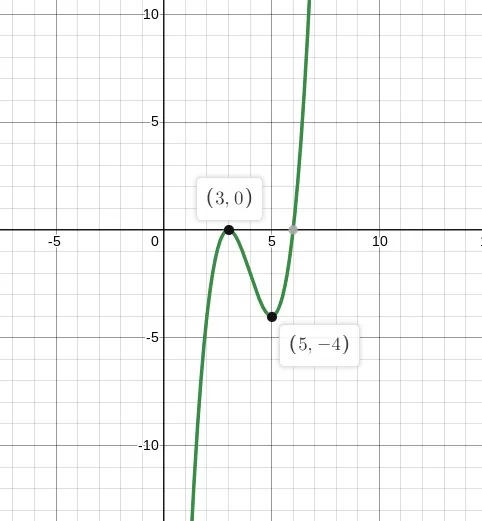
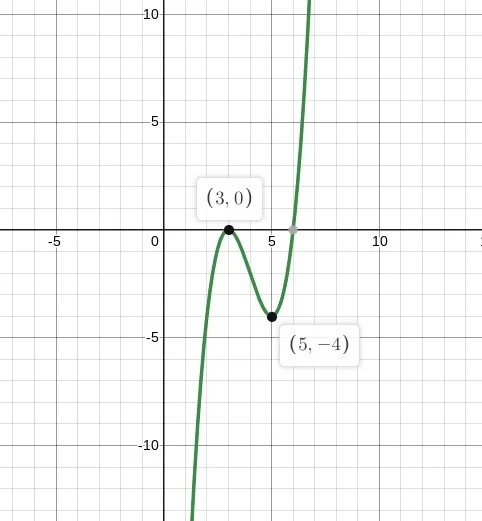
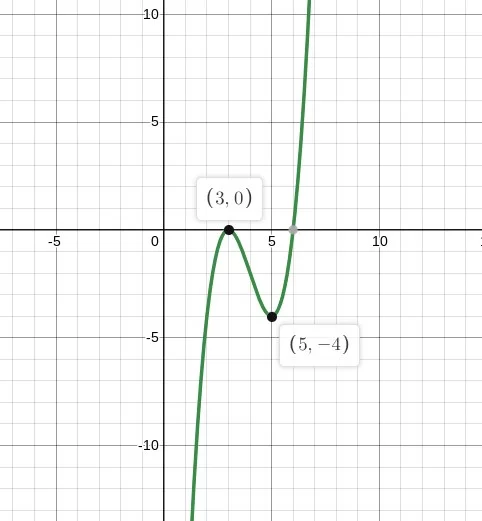
What is the relative maximum?
Explanation
The relative maximum is the local peak on the graph, located at the point (3,0).
🚩 Report
What is the relative minimum?
Explanation
The relative minimum is the local low point on the graph, located at the point (5,-4).
🚩 Report
As \(x \to -\infty, f(x) \to \)
A
\(\infty\)
B
\(-\infty\)
Explanation
As the x-values decrease towards negative infinity, the graph moves downwards toward negative infinity.
🚩 Report
As \(x \to \infty, f(x) \to \)
A
\(\infty\)
B
\(-\infty\)
Explanation
As the x-values increase towards positive infinity, the graph moves upwards toward positive infinity.
🚩 Report
Increasing Interval(s): (Choose all that apply)
A
\((-\infty, 0)\)
B
\((-\infty, 3)\)
C
(3, 5)
D
\((-4, \infty)\)
Explanation
The graph is moving upward on the interval from negative infinity until it reaches x = 3.
🚩 Report
Decreasing Interval(s): (Choose all that apply)
A
\((-\infty, 0)\)
B
\((-\infty, 3)\)
C
(3, 5)
D
\((5, \infty)\)
Explanation
The graph is moving downward on the interval between the peak at x = 3 and the valley at x = 5.
Result Tracking
Answered
0 / 16
Correct Answers
0
Wrong Answers
0
Current Percentage
0%
Quiz Completed
This is your final result after answering all questions.
Final Result
0/16
0%
Correct Answers
0
Wrong Answers
0
Answered Questions
0 / 16
Total Possible Points
16
You can reopen the page to start again.