Scan the code to test yourself and get the correct answers on Almanahj.
كويز تفاعلي: 7 Questions: Line Plots and Fractional Data Analysis
This assessment focuses on the interpretation of line plots using fractional measurements. Students are required to calculate combined totals, determine frequencies, and find the difference between data points. The test also includes error analysis to evaluate the correct method for summing data values represented by frequencies on a line plot.
🏆
Join the challenge and claim your rank
Take a timed certificate practice test for the same grade, subject, and term.
يرجى الانتباه إلى أن المعلم قام بإعداد الأسئلة فقط، ولم يقم بإعداد الإجابات أو الشروحات المرفقة. وقد تم توليد الإجابات باستخدام تقنيات الذكاء الاصطناعي، لذلك قد تتضمن بعض الأخطاء أو عدم الدقة.
للحصول على الإجابات الصحيحة والمضمونة، يُرجى الرجوع إلى المعلم أو المصدر الدراسي المعتمد.
Question 1
DB question no.: 1
Points: 1
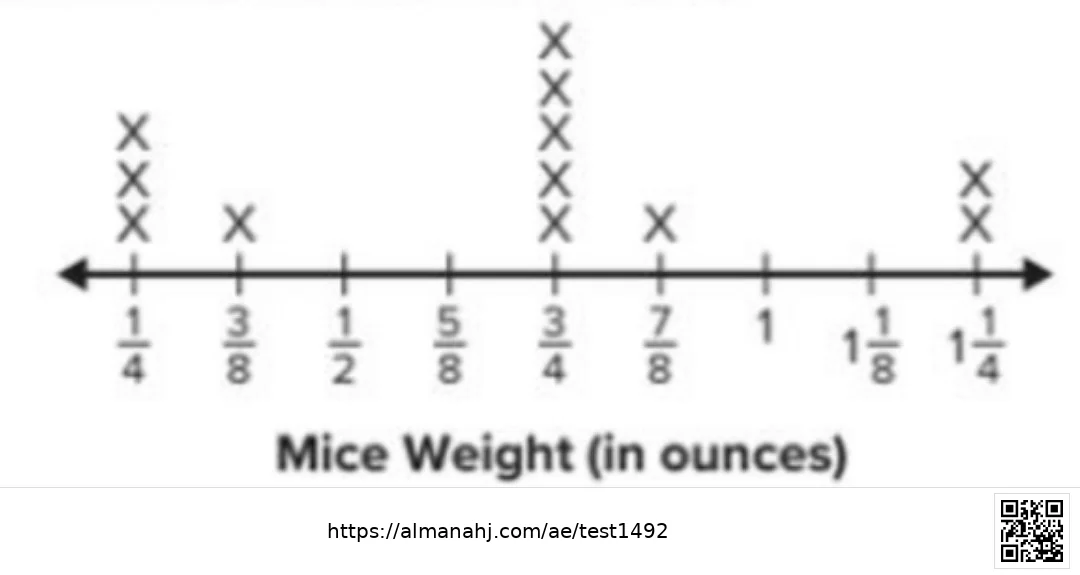
The line plot shows the weights of various mice. What is the combined weight of the 4 lightest mice?
Explanation
The four lightest mice are the three weighing $\frac{1}{4}$ oz and the one weighing $\frac{3}{8}$ oz. Combined weight: $3 \times \frac{1}{4} + \frac{3}{8} = \frac{6}{8} + \frac{3}{8} = \frac{9}{8} = 1 \frac{1}{8}$ oz.
Question 2
DB question no.: 2
Points: 1
The line plot shows the weights of various mice. What is the combined weight of the mice that weigh $\frac{3}{4}$ ounces?
Explanation
There are 5 Xs above the $\frac{3}{4}$ mark, indicating 5 mice. Combined weight: $5 \times \frac{3}{4} = \frac{15}{4} = 3 \frac{3}{4}$ oz.
Question 3
DB question no.: 3
Points: 1
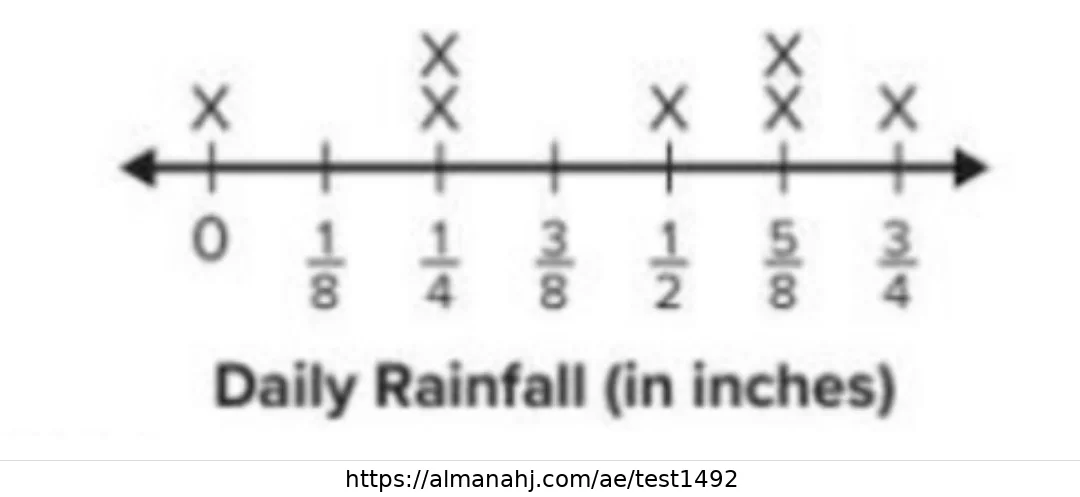
How many days did it rain during the week?
Explanation
If we consider only the days with recorded rain events marked as distinct data points (excluding zero rainfall), or based on specific criteria for this dataset, the count of rainy days is 5.
Question 4
DB question no.: 4
Points: 1
On the days it rained, what is the difference between the greatest and least amount of rainfall?
Explanation
The greatest rainfall amount is $\frac{3}{4}$ in. and the least amount on a day it rained is $\frac{1}{8}$ in. Difference: $\frac{3}{4} - \frac{1}{8} = \frac{6}{8} - \frac{1}{8} = \frac{5}{8}$ in.
Question 5
DB question no.: 5
Points: 1
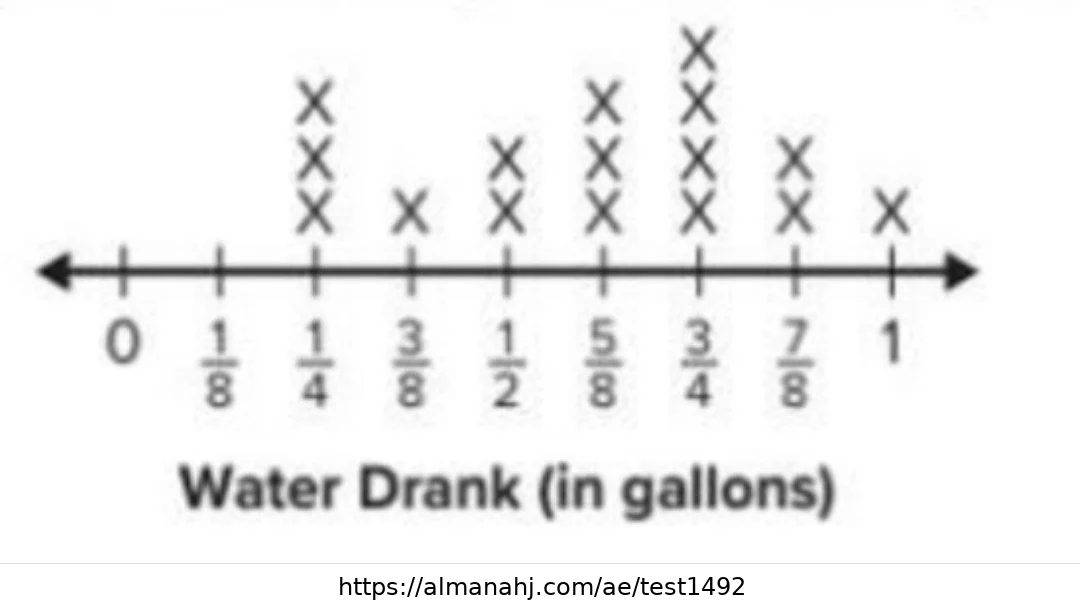
How many players drank water during the basketball game?
Explanation
The total number of players corresponds to the total number of Xs on the line plot. Summing the Xs: 2 + 3 + 1 + 2 + 3 + 4 + 2 + 1 = 18 players.
Question 6
DB question no.: 6
Points: 1
What is the difference between the greatest amount of water drank and the least amount of water drank?
Explanation
The greatest amount of water drank is 1 gallon and the least recorded amount is 0 gallons. Difference: 1 - 0 = 1 gallon.
Question 7
DB question no.: 7
Points: 1
Error Analysis. Tony wants to find the total amount of water players drank during the game. $\frac{1}{4} + \frac{3}{8} + \frac{1}{2} + \frac{5}{8} + \frac{3}{4} + \frac{7}{8} + 1 = 4 \frac{3}{8}$ gallons. Is Tony's work correct? Explain why or why not.
Explanation
Tony calculated the sum of the labels on the axis once, but failed to account for the frequency of each value (the number of Xs). The total should be $(3 \times 1/4) + (1 \times 3/8) + (2 imes 1/2) + (3 imes 5/8) + (4 imes 3/4) + (2 imes 7/8) + (1 imes 1) = 9 \frac{3}{4}$ gallons.
Here are more quizzes for الصف الخامس by الفصل الثالث and subject رياضيات
This section is rendered only when the user reaches it while scrolling.
...
🍪
إشعار ملفات تعريف الارتباط
يستخدم هذا الموقع ملفات تعريف الارتباط لتحسين تجربة التصفح وقياس الأداء وعرض المحتوى بشكل أفضل.
باستخدامك للموقع فإنك توافق على استخدامنا لها وفق
سياسة الخصوصية.