Interactive multiple-choice quiz: Two-Way Tables and Relative Frequencies Quiz
هذا الاختبار يتناول فهم وتفسير جداول البيانات ذات الاتجاهين (Two-Way Tables) واستخدام الترددات النسبية (Relative Frequencies). تتضمن الأسئلة تحليل بيانات حول مشاركة الطلاب في الأندية، وعادات شراء أو إحضار الغداء، واستخدام الحافلات المدرسية، مع التركيز على استنتاج العلاقات والإحصائيات من الجداول المقدمة.
🏆 انضم إلى التحدي واحصل على ترتيبك
اختبار شهادة تدريبي مؤقت للصف والمادة والفصل نفسه.
اختر إجابة واحدة لكل سؤال. عند الاختيار ستظهر النتيجة فورًا: الأخضر صحيح، والأحمر خطأ، وسيظهر تفسير الإجابة مباشرة إن كان متوفرًا. وبعد آخر سؤال ستظهر الدرجة النهائية تلقائيًا.
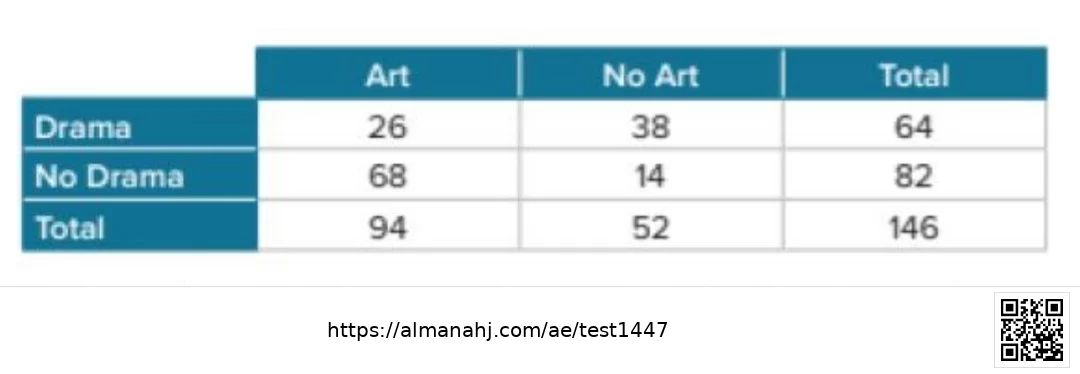
The animation shows the following two-way table containing the results of a survey about drama and art participation. One hundred forty-six students were surveyed. Each row shows the frequency of student participation in drama. Each column shows the frequency of student participation in art. Twenty-six students participate in both art and drama. Fourteen students do not participate in either art or drama. How many students participate in drama, but not art?
Explanation
According to the two-way table, the number of students who participate in drama (row 'Drama') but not in art (column 'No Art') is 38.
Question 2
2
Points: 1
Omar surveyed students at his school. He found that 23 students are in the Chess Club, and 8 of those students are in the Math Club. There are 19 students that are in the Math Club. Ten students are in neither club. Construct a two-way table summarizing the data.
Explanation
Based on the given information: 23 students in Chess Club, 8 in both Chess and Math, 19 in Math Club total, 10 in neither. We can deduce the following two-way table: Chess Club and Math Club = 8. Chess Club and No Math Club = 23 - 8 = 15. No Chess Club and Math Club = 19 - 8 = 11. No Chess Club and No Math Club = 10. Total Chess Club = 8 + 15 = 23. Total No Chess Club = 11 + 10 = 21. Total Math Club = 8 + 11 = 19. Total No Math Club = 15 + 10 = 25. Overall Total = 23 + 21 = 44.
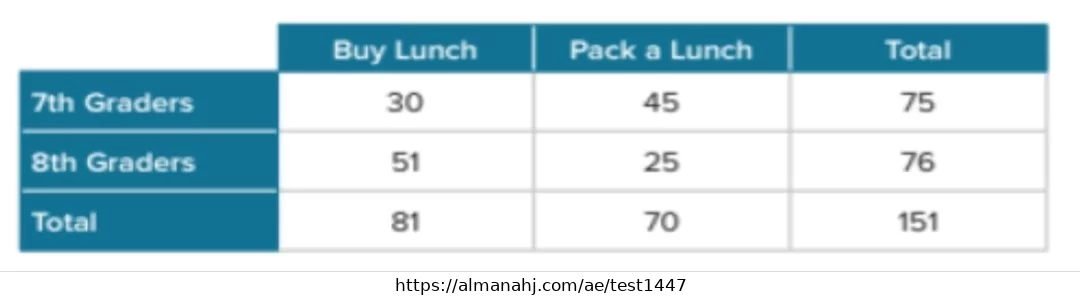
The table shows the results of a survey that asked seventh and eighth grade students whether they buy or pack their lunch. Find the relative frequencies. Round to the nearest hundredth. Are seventh graders or eighth graders more likely to buy their lunch? Explain.
Explanation
The relative frequency for 7th graders to buy lunch is $30 \div 75 = 0.40$. The relative frequency for 8th graders to buy lunch is $51 \div 76 \approx 0.67$. Since 0.67 > 0.40, 8th graders are more likely to buy their lunch.
Question 4
4
Points: 1
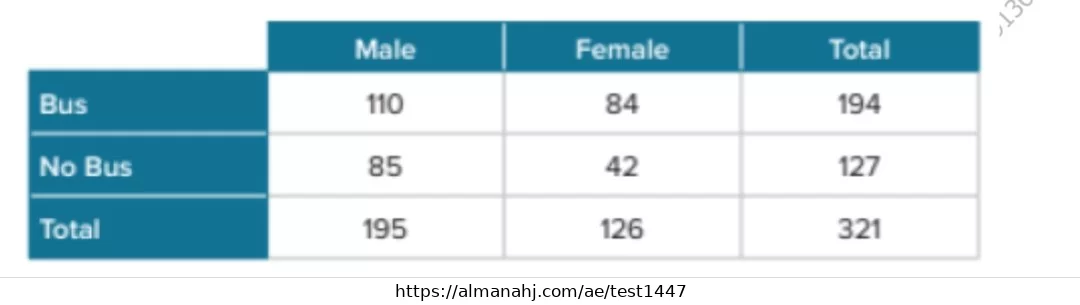
The table shows the results of a survey about the number of bus riders at McGuffey Junior High. Find the relative frequencies. Round to the nearest hundredth. Are male students or female students more likely to not ride the bus? Explain.
Explanation
The relative frequency for male students not to ride the bus is $85 \div 195 \approx 0.44$. The relative frequency for female students not to ride the bus is $42 \div 126 \approx 0.33$. Since 0.44 > 0.33, male students are more likely to not ride the bus.
Result Tracking
Answered0 / 4
Correct Answers0
Wrong Answers0
Current Percentage0%
Quiz Completed
This is your final result after answering all questions.
Final Result
0/40%
Correct Answers0
Wrong Answers0
Answered Questions0 / 4
Total Possible Points4
You can reopen the page to start again.
يمكنك تسجيل الدخول لحفظ سجل محاولاتك، معرفة أخطائك المتكررة، والحصول على نصائح مخصصة. تسجيل الدخول باستخدام Google
Here are more quizzes for الصف الثامن by الفصل الثالث and subject رياضيات
This section is rendered only when the user reaches it while scrolling.
...
🍪
إشعار ملفات تعريف الارتباط
يستخدم هذا الموقع ملفات تعريف الارتباط لتحسين تجربة التصفح وقياس الأداء وعرض المحتوى بشكل أفضل.
باستخدامك للموقع فإنك توافق على استخدامنا لها وفق
سياسة الخصوصية.