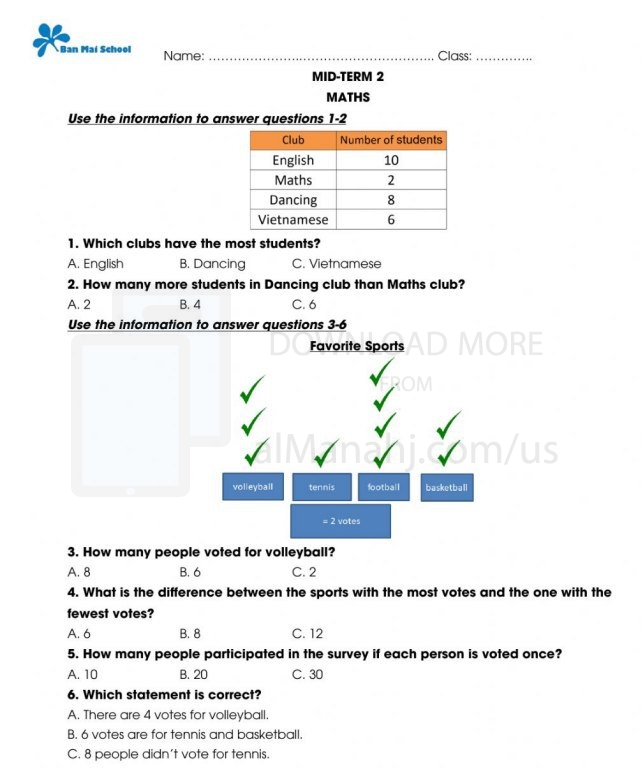
| File info: The Worksheet about Charts in Math is a valuable educational resource designed to help students understand and analyze data presented in chart or graph form. This worksheet provides structured exercises and activities that aim to enhance students' skills in interpreting, creating, and utilizing various types of charts commonly used in mathematics.
1. Chart Types:
The worksheet covers a variety of chart types commonly used in math, including bar charts, line graphs, pie charts, scatter plots, histograms, and pictographs. Each chart type presents data in a different format, allowing students to become familiar with different ways of representing numerical information visually.
2. Data Interpretation:
The worksheet focuses on developing students' ability to interpret data presented in charts. It includes exercises where students analyze given charts to identify key information, trends, patterns, and relationships between variables. By engaging with these exercises, students learn how to extract meaningful insights from visual representations of data.
3. Chart Creation:
The worksheet provides opportunities for students to create their own charts based on given data sets or real-world scenarios. These exercises help students develop their graphing skills and understand the process of selecting an appropriate chart type for specific data. Students learn how to organize data, label axes, and create a clear and accurate representation of information.
4. Data Comparison:
The worksheet includes exercises that require students to compare and contrast data presented in different charts. By analyzing multiple charts simultaneously, students gain insights into how different chart types can convey information differently and highlight different aspects of the data. This exercise promotes critical thinking and encourages students to consider the most effective chart type for a given dataset.
5. Data Analysis:
The worksheet incorporates activities that prompt students to analyze and draw conclusions based on the data presented in charts. Students may be asked to calculate averages, identify outliers, make predictions, or draw inferences from the given data. This fosters students' ability to apply mathematical concepts and logical reasoning to make sense of the information presented in charts.
6. Chart Reading Skills:
The worksheet includes exercises designed to enhance students' chart reading skills. These activities may involve interpreting labels, scales, legends, and other elements of a chart to extract relevant information accurately. Students learn how to read and understand the various components of a chart, ensuring they can effectively analyze and interpret data in a mathematical context.
7. Real-World Applications:
The worksheet incorporates real-world examples and scenarios to demonstrate the practical applications of chart reading and data analysis skills. By connecting mathematical concepts to real-life situations, students understand the relevance and importance of charts in various fields, such as economics, science, and social studies.
The Worksheet about Charts in Math serves as a valuable tool for students to develop skills in interpreting and creating charts, analyzing data, and making informed conclusions. By engaging with the exercises and activities provided, students enhance their ability to comprehend and work with visual representations of data, improving their mathematical literacy and critical thinking skills. The worksheet promotes a deeper understanding of mathematical concepts and their application in real-world contexts. |
