| You are here: Almanahj Website ⇒ American curriculum ⇒ 8th Grade ⇒ Information and comm ⇒ Term 1 | ||
|---|---|---|
Worksheet about Communicating with Graphs and Technology | ||
|---|---|---|
| Subject: Information and comm | ||
| 8th Grade | ||
| Term 1 | ||
| Year: 2023/2024 | ||
| Size: 207.9KB | ||
| Number of clicks: 41 | ||
| Publish date:November 12, 2023 | ||
| Added by: Eman | ||
| Last download date: 2024-09-05 15:37:53 | ||
| Updated by: Eman9966 on 2023-11-12 16:05:21 | By: theodor Gina Martinez | |
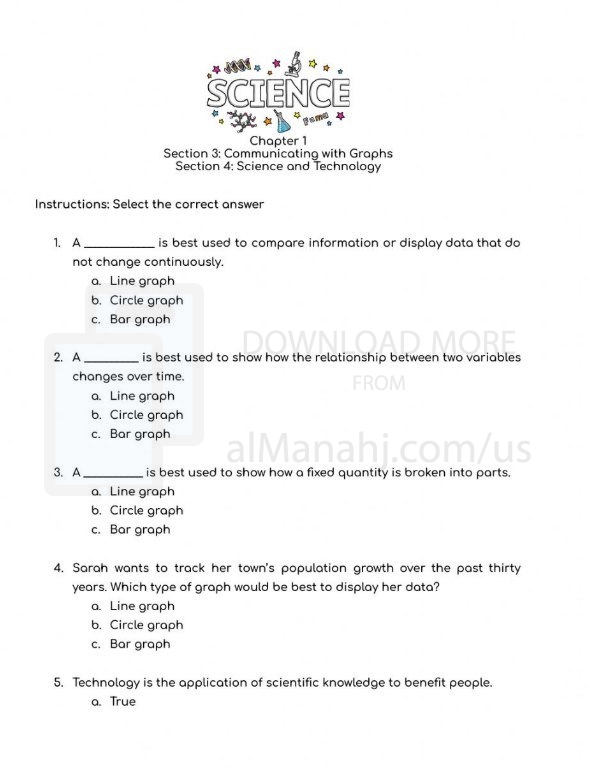
| File info: Communicating with Graphs and Technology Graphs are a powerful tool for communication. They can be used to convey complex information in a clear and concise way. Graphs can be used to represent data, relationships, or processes. There are many different types of graphs, each with its own strengths and weaknesses. Some common types of graphs include: Line graphs: Line graphs are used to track changes over time. They are often used to represent data such as sales, temperature, or population. Bar charts: Bar charts are used to compare different values. They are often used to represent data such as product sales, market share, or test scores. Pie charts: Pie charts are used to represent parts of a whole. They are often used to represent data such as market share, customer satisfaction, or budget allocation. Scatter plots: Scatter plots are used to show the relationship between two variables. They are often used to represent data such as the relationship between price and demand, or the relationship between height and weight. Histograms: Histograms are used to show the distribution of data. They are often used to represent data such as the distribution of test scores, or the distribution of income. Graphs can be used to communicate information in a variety of settings. They are often used in business, education, and government. Graphs can be used to communicate information to a variety of audiences, including technical and non-technical audiences. Technology can make it easier to create and use graphs. There are many software programs that can be used to create graphs. These programs can make it easy to create professional-looking graphs with a variety of features. Here are some tips for communicating with graphs: Choose the right type of graph for your data. Label your graphs clearly. Use a consistent scale. Make sure your graphs are easy to read. Use colors and fonts that are easy to see. By following these tips, you can use graphs to communicate information effectively. | ||
| Downloading link Worksheet about Communicating with Graphs and Technology |
|---|
|
1699789723.pdf
The file is being prepared for download
|
| File images |
|---|
 |